Transcription of SPSS Manual for Introductory Applied Statistics: A ...
1 spss Manual forIntroductory Applied Statistics: A variable ApproachJohn GabrosekDepartment of StatisticsGrand Valley State UniversityAllendale, MI USAA ugust 20132 Copyright 2013 John Gabrosek. All rights reserved. No part of this pub-lication may be reproduced, stored in a retrieval system, or transmitted, inany form or by any means, electronic, mechanical, photocopying, recording,or otherwise, without the prior written permission of the copyright Introduction to Accessing spss and Opening Files .. spss Data Entry .. spss Data View Menu .. spss Output Window .. spss Saving and Copying .. spss Chart Editor ..161 spss One Categorical Taking a Simple Random Sample .. Sorting a Dataset .. Frequency Table .. Bar Graph .. Editing a Bar Graph .. Pie Graph .. Editing a Pie Graph.
2 362 spss One Quantitative Numerical Summaries .. Boxplot .. Editing a Boxplot .. Histogram .. Editing a Histogram .. Normal Distribution Probabilities .. CI for the Population Mean .. HT for the Population Mean ..583 spss Two Categorical Two-Way Tables .. Clustered Bar Graph .. Editing a Clustered Bar Graph .. 2 Test .. CI for two Proportions ..744 spss Two Quantitative Scatterplots .. Editing a Scatterplot .. Linear Correlationr.. Simple Linear Regression .. Hypothesis Test for the Slope .. Confidence Interval for the Slope ..885 spss for Independent Two-Group Numerical Summaries Two-Groups .. Comparative Boxplot .. Editing a Comparative Boxplot .. Comparative Histogram .. Editing a Comparative Histogram .. Independent T-Test.
3 CI for 1 2.. 1056 spss Paired Selecting Data .. Finding the Paired Differences .. Summaries for Paired Data .. CI for d.. Paired T-Test .. 1147 spss for One-Way ANOVA Numerical and Graphical Summaries For ANOVA Data .. Sums of Squares and the ANOVA Table .. ANOVA F-Test .. Post Hoc Comparisons for ANOVA .. 125 Chapter 0 Introduction to Accessing spss and Opening Existing DataFilesOn the Grand Valley State University (GVSU) campuses spss is availablefrom the student network. To open spss do the following:Accessing the spss Program On the desktop, click on the Applications folder. This will bring up alist of folders, one for each department. Scroll down to the folder named statistics . Click on this folder. You willsee a list of programs used by statistics Department faculty.
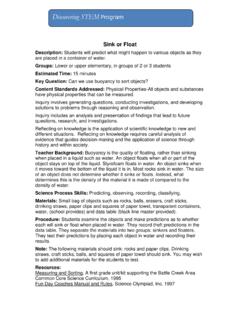
4 Find the icon for spss 20. Click on this clicking on the spss 20 icon, the dialog box in Figure opens. Noticethat the default choice is Open an existing data source. Use this option ifyou are opening a data file that already exists. The other common choice is Type in data. Use this option (by clicking on the circle next to it), if youare going to type in !In Figure we have cutoff part of the bottom of thedialog box to save space. We will often do that in this spss 0. INTRODUCTION TO SPSSF igure : Dialog box for opening a data file or entering an Existing Data FileExisting data files are usually in either spss format, Excel format, or Textformat. spss data files have the file extension .sav. Excel data files have thefile extension .xls or .xlsx. Text files have the file extension .txt. Most of thefiles used in the textbook are saved in spss used in this course are generally saved on the campus-wide R:drive underthe the R:drive To access the R:Drive we click OK when the dialog box in Figure open.
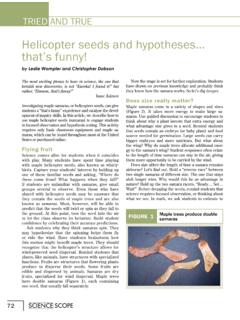
5 This results in the dialog box in Figure The default foryou will not look the same as for anyone else because each student has adifferent account on the student network. However, you will be able toget to the R:drive in a similar way to any other student. Click on the downward arrow next to Look In:. You will get a separatedialog box that lists all the directories to which you have access. (SeeFigure ) Scroll until you locate the R:drive. This is named GVSU-LABDATA.. (R:). Clicking on the R:drive will open up a list of folders. Scroll and click onthe folder namedSTAthengabrosek. From this point on you need tonavigate to find the particular data file you want to open. Data files spss DATA ENTRY3 Figure : Dialog box for finding data : Dialog box for finding files on the the textbook are available in the folderSTA215 collected in-class are available in the folderSTA215 spss Windows: Data Editor - Data EntryThere are three main windows in spss .
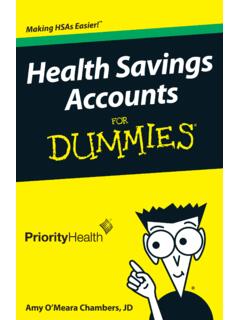
6 They are (1) the Data Editor, (2) theOutput (also called the statistics Viewer), and (3) the Chart Editor. In thissection we discuss the role of the Data Editor window in data shows a portion of the Data Editor window (the Data View) withno data yet entered. Notice in the lower left corner of Figure that thereare two tabs named; Data View and variable View. By default spss showsthe Data View when the Data Editor is first Data View tab of the spss Data Editor is set up similarly to an Excelspreadsheet with a few important differences. As in Excel, each row is a case4 CHAPTER 0. INTRODUCTION TO SPSSF igure : spss Data Editor window - Data View observation. In the textbook we use the termindividual. As in Excel,each column is a variable measured on the individuals that make up the !Unlike Excel, in spss we DO NOT put the variablenames in the first ViewThe variable View tab is used for information about each of the access the variable View by clicking once on the tab.
7 Figure showsthe variable View with no information row in the variable View corresponds to a variable . For example, row 1in the variable View would correspond to Column 1 in the Data View. Eachcolumn of the variable View provides a different piece of information aboutthe variable . The columns are:1. Column - NameWe enter the name in row 1 under the column Name. As soon as thename is entered, by default spss fills in the remaining columns. (SeeFigure where we have entered a variable named sex. We have elimi-nated the last three columns of the variable View in this figure to savespace and because we generally do not worry about these columns.) spss DATA ENTRY5 Figure : spss Data Editor window - variable View !Keep variable names short. We have the option forexpanded labels for variables elsewhere in the variable : Default information in spss Data Editor window - variable View Column - TypeBy default spss will assume a variable is numeric.
8 (This is what wecalled quantitative in the textbook.) If you want a categorical variableyou can request it. To get a categorical variable : Click on the lower right corner in the row under the column shows the possible choices. By default a numeric variableis chosen with 2 decimal places. To change to a categorical variable click on String. Then, clickOK. For our purposes almost all variables will be either numeric !Sometimes we use numbers to represent a cat-egorical variable . In that case we choose Type = Numeric,even though the data is really 0. INTRODUCTION TO SPSSF igure : variable types in the spss Data Editor - variable View Column - WidthBy default spss uses 8 characters as the column width. You may changethis by clicking in the column and typing in a new value or using theup/down arrow that Column - DecimalsBy default spss uses two decimal places for numeric data.
9 You maychange this by clicking in the column and typing in a new value or usingthe up/down arrow that Column - LabelOften variable names are kept short. This can be confusing in , descriptive labels can be added that will appear in spss output(and spss dialog boxes). To add a label click in the Label column andtype in the label you want. For example, let s label the variable Sex as Gender. Message!Don t go overboard on a label s length. Extremelylong labels will crowd out the tables or graphs you make Column - ValuesWhen a categorical variable is entered using numbers (such as the vari-able class with 1 = Freshman, 2 = Sophomore, 3 = Junior, and 4 = spss DATA ENTRY7 Senior), spss treats it as a numeric variable . The variable type is nu-meric. But, these numbers are simply chosen for ease of data actual value is the category.
10 spss allows you to assign the numericvalues to a particular category. To do so for the variable class: Click in the lower right corner of the Values column. Figure you the values dialog : Assigning categories to numeric values in spss Data Editor - variable Viewwindow. To assign category freshman to value 1, click on the empty box nextto Value. Type in a 1. Next, click on the empty box next to Label. Type in Freshman. Click !Do not click OK until you have added a labelfor each remaining columns are not of central importance to us. We leavethese at the default s illustrate with a small data set to type into spss . The data are givenbelow in Table For each of 10 students we collected information on threevariables; sex (male or female), height (inches), and class (enter as 1 = fresh-man, 2 = sophomore, 3 = junior, and 4 = senior).