Transcription of SPSS Statistics 19 Step by Step: Answers to Selected Exercises
1 IBM spss Statistics 19 step by step A Simple Guide and Reference 12th Edition Answers to Selected Exercises Darren George, Canadian University College Paul Mallery, La Sierra University 2 IBM spss Statistics 19 step by step Answers to Selected Exercises Contents General Notes .. 5 Chapter 3: Creating and Editing a Data File .. 6 3-2 .. 7 3-3 .. 7 3-5 .. 7 3-6 .. 7 3-7 .. 8 3-8 .. 8 Chapter 4: Managing Data .. 9 4-2 .. 10 4-3 .. 11 4-6 .. 12 4-8 .. 13 4-9 .. 13 13 13 13 14 Chapter 5: Graphs .. 15 5-1 .. 16 5-2 .. 16 5-4 .. 17 5-5 .. 17 Chapter 6: Frequencies .. 18 6-1 .. 19 6-3 .. 19 6-4 .. 20 6-6 .. 20 Chapter 7: Descriptive Statistics .. 21 7-1 .. 22 7-2 .. 22 IBM spss Statistics 19 step by step Answers to Selected Exercises 3 Chapter 8: Crosstabulation and 2 Analyses .. 23 8-1 .. 24 8-2 .. 25 8-3 .. 25 Chapter 9: The Means Procedure .. 26 9-1 .. 27 9-3 .. 28 Chapter 10: Bivariate Correlation .. 29 30 Chapter 11: The T Test Procedure .. 31 33 35 35 36 37 37 Chapter 12: The One-Way ANOVA Procedure.
2 38 39 40 41 41 Chapter 14: Three-Way ANOVA .. 42 44 46 46 47 49 Chapter 15: Simple Linear Regression .. 50 52 53 53 53 53 54 4 IBM spss Statistics 19 step by step Answers to Selected Exercises Chapter 16: Multiple Regression Analysis .. 55 57 57 Chapter 18: Reliability Analysis .. 58 59 60 61 Chapter 23: MANOVA and MANCOVA .. 62 63 64 64 Chapter 24: Repeated-Measures MANOVA .. 65 66 66 67 IBM spss Statistics 19 step by step Answers to Selected Exercises 5 General Notes The following Answers are in some cases fairly complete. In other cases, only portions of the answer are in-cluded. The data files used are available for download at Check with your instructor to find exactly what she or he wants you to turn in. We list the questions from each chapter first, followed by Answers to Selected Exercises . 6 IBM spss Statistics 19 step by step Answers to Selected Exercises Chapter 3: Creating and Editing a Data File 1.
3 Set up the variables described above for the file, using appropriate variable names, varia-ble labels, and variable values. Enter the data for the first 20 students into the data file. 2. Perhaps the instructor of the classes in the dataset teaches these classes at two different schools. Create a new variable in this dataset named school, with values of 1 and 2. Create variable labels, where 1 is the name of a school you like, and 2 is the name of a school you don t like. Save your dataset with the name 3. Which of the following variable names will spss accept, and which will spss reject? For those that spss will reject, how could you change the variable name to make it legal ? age firstname @edu sex. grade not anxeceu date iq 4. Using the file, make the gpa variable values (which currently have two digits after the dec-imal point) have no digits after the decimal point. You should be able to do this without retyping any numbers.
4 Note that this won t actually round the numbers, but it will change the way they are displayed and how many digits are displayed after the decimal point for statistical analyses you perform on the numbers. 5. Using , search for a student who got 121 on the final exam. What is his or her name? 6. Why is each of the following variables defined with the measure listed? Is it possible for any of these variables to be defined as a different type of measure? ethnicity Nominal extrcred Ordinal quiz4 Scale grade Nominal 7. Ten people were given a test of balance while standing on level ground, and ten other people were giv-en a test of balance while standing on a 30 slope. Their scores follow. Set up the appropriate varia-bles, and enter the data into spss . Scores of people standing on level ground: 56, 50, 41, 65, 47, 50, 64, 48, 47, 57 Scores of people standing on a slope: 30, 50, 51, 26, 37, 32, 37, 29, 52, 54 8. Ten people were given two tests of balance, first while standing on level ground and then while standing on a 30 slope.
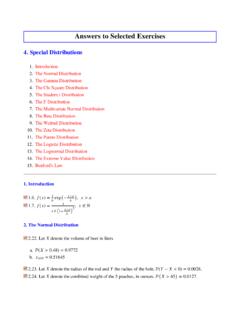
5 Their scores follow. Set up the appropriate variables, and enter the data into spss . Participant: 1 2 3 4 5 6 7 8 9 10 Score standing on level ground: 56 50 41 65 47 50 64 48 47 57 Score standing on a slope: 38 50 46 46 42 41 49 38 49 55 IBM spss Statistics 19 step by step Answers to Selected Exercises 7 3-2 The variable view screen might look something like this once the new variable is set up: 3-3 Variable Name spss What could be changed? Age Accept sex. Reject Variable names can t include a . so just use sex without a period. 3-5 Dawne Rathbun received a score of 121 for the course. No one received a score of 121 on the final exam. 3-6 Variable Currently de-fined as Could also be defined as ethnicity Nominal Ethnicity will generally be defined as a nominal variable. The only exceptions might be if, for example, you were examining the relative size of different ethnici-ties in a certain population. In that case, where ethnicity has other theoretical meaning, ethnicity could be defined as an ordinal variable.
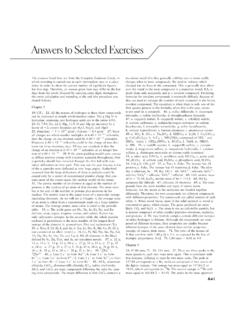
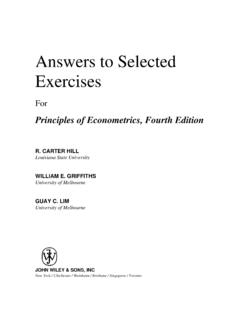
6 8 IBM spss Statistics 19 step by step Answers to Selected Exercises 3-7 The variable view should look something like this, with one variable identifying whether the person was stand-ing on level or sloped ground and a second variable identifying each person s balance score: Once the data is entered, the data view should look something like this: 3-8 Note that, because each person took the balance test both on level ground and on a slope, there are ten rows (one for each person) rather than twenty rows (one for each time the balance test was given). IBM spss Statistics 19 step by step Answers to Selected Exercises 9 Chapter 4: Managing Data Some of the Exercises that follow change the original data file. If you wish to leave the data in their original form, don t save your changes. Note that if you are using the student version of spss , you should use the file instead of , and the file instead of Case Summaries 1. Using the file, list variables (in the original order) from id to quiz5, first 30 students con-secutive, fit on one page by editing.
7 2. Using the file, list variables hclose, hseveret, angert, hcontrot, sympathi, worry, ob-ligat, hcopet, first 30 cases, fit on one page by editing. 3. List the first 30 students in the file, with the lower division students listed first, followed by the upper division students (lowup variable). Missing Values 4. Using the file delete the quiz1 scores for the first 20 subjects. Replace the (now) missing scores with the average score for all other students in the class. Print out lastname, firstname, quiz1 for the first 30 students. Edit to fit on one page. Computing Variables 5. Calculate total (the sum of all five quizzes and the final) and percent (100 times the total divided by the points possible, 125). Since total and percent are already present, name the new variables total1 and percent1. Print out id, total, total1, percent, percent1, first 30 subjects. Total and total1; percent and percent1 should be identical. 6. Using the file compute a variable named spirit (spirituality) that is the mean of sp8 through sp57 (there should be 18 of them).
8 Print out id, sex, and the new variable spirit, first 30 cas-es, edit to fit on one page. 7. Using the file, compute a variable named quizsum that is the sum of quiz1 through quiz5. Print out variables id, lastname, firstnam, and the new variable quizsum, first 30, all on one page. Recode Variables 8. Using the file, compute a variable named grade1 according to the instructions on page 55. Print out variables id, lastname, firstnam, grade and the new variable grade2, first 30, edit to fit all on one page. If done correctly, grade and grade2 should be identical. 9. Using the file; recode a passfail1 variable so that D s and F s are failing, and A s, B s, and C s are passing. Print out variables id, grade, passfail1, first 30, edit to fit all on one page. 10. Using the file, redo the coding of the ethnic variable so that Black = 1, Hispanic = 2, Asian = 3, Caucasian = 4, and Other/DTS = 5. Now change the value labels to be consistent with reality (that is the coding numbers are different but the labels are consistent with the original ethnicity).
9 Print out the variables id and ethnic, first 30 cases, fit on one page. Selecting Cases 11. Using the file select females (sex = 1); print out id and sex, first 40 subjects, numbered, fit on one page. 10 IBM spss Statistics 19 step by step Answers to Selected Exercises 12. Select all of the students in the file whose previous GPA s are less than , and whose percentages for the class are greater than 85. Print results. 13. Using the file, select females (gender = 1) who give more than the average amount of help (thelplnz > 0). Print out id, gender, thelplnz, first 40 subjects, numbered, fit on one page. Sorting Cases 14. Alphabetize the file by lastname, firstnam, Print out lastname, firstname, first 40 cases, edit to fit on one page. 15. Using the file, sort by id (ascending order). Print out id, total, percent, and grade, first 40 subjects, fit on one page. 4-2 .. IBM spss Statistics 19 step by step Answers to Selected Exercises 11 4-3 Case Summaries lastname firstname Lower or upper divi-sion Lower 1 VILLARRUZ ALFRED 2 OSBORNE ANN 3 LIAN JENNY 4 MISCHKE ELAINE 5 WU VIDYUTH 6 TORRENCE GWEN 7 CARPIO MARY 8 SAUNDERS TAMARA Total N 8 8 Upper 1 VALAZQUEZ SCOTT 2 GALVEZ JACKIE 3 GUADIZ VALERIE 4 RANGIFO TANIECE 5 TOMOSAWA DANIEL 6 BAKKEN KREG 7 LANGFORD DAWN 8 VALENZUELA NANCY 9 SWARM MARK 10 KHOURY DENNIS 11 AUSTIN DERRICK 12 POTTER MICKEY 13 LEE JONATHAN 14 DAYES ROBERT 15 STOLL GLENDON 16 CUSTER JAMES 17 CHANG RENE 18 CUMMINGS DAVENA 19 BRADLEY SHANNON 20 JONES ROBERT 21 UYEYAMA VICTORINE 22 LUTZ WILLIAM Total N 22 22 Total N 30 30 a Limited to first 30 cases.
10 4-5 Follow sequence steps 5c and 5c to complete this calculation. 12 IBM spss Statistics 19 step by step Answers to Selected Exercises 4-6 Note that if you are using the student version of spss , you should use the file in-stead of for this exercise . Case Summaries SEX SPIRIT 1 1 female 2 1 female 3 1 female 4 1 female 5 1 female 6 2 male 7 2 male 8 1 female 9 2 male 10 1 female 11 1 female 12 1 female 13 2 male 14 2 male 15 2 male 16 1 female 17 2 male 18 2 male 19 1 female 20 1 female 21 1 female 22 1 female 23 1 female 24 2 male 25 2 male 26 1 female 27 2 male 28 1 female 29 2 male 30 1 female Total 30 30 IBM spss Statistics 19 step by step Answers to Selected Exercises 13 4-8 Case Summaries ID LASTNAME FIRSTNAME GRADE GRADE2 1 106484 VILLARRUZ ALFRED D D 2 108642 VALAZQUEZ SCOTT C C 3 127285 GALVEZ JACKIE C C 4 132931 OSBORNE ANN B B 5 140219 GUADIZ VALERIE B B a Limited to first 30 cases.