Transcription of SPSS Step-by-Step Tutorial: Part 1 - DataStep
1 spss Step-by-Step Tutorial: Part 1. For spss Version DataStep Development 2004. Table of Contents 1 spss Step-by-Step 5. introduction 5. Installing the data 6. Installing files from the Internet 6. Installing files from the diskette 6. Introducing the interface 6. The data view 7. The variable view 7. The output view 7. The draft view 10. The syntax view 10. What the heck is a crosstab? 12. 2 Entering and modifying data 13. Creating the data definitions: the variable view 13. Variable types 13. spss Step-by-Step 3. Variable names and labels 15. Missing values 15. Non-numeric numbers, or when is a number not a number? 15. Binary variables 15. Creating a new data set 16. Getting help in creating data sets and defining variables 22. Creating primary reference lists 24. Frequencies 24. Descriptive statistics: descriptives (univariate) 25. Recodes and Transformations 26. Backup the original file 26. Recoding existing variables 27. Recode income data 27. Recoding variables revisited 37. The one exception in recoding variables 37.
2 The other exception 37. 3 Charting your data 39. Using the automated chart function 40. Using the Interactive Chart function 42. Creating a chart from scratch 45. 4 spss Step-by-Step 1 spss Step-by-Step introduction spss (Statistical Package for the Social Sciences) has now been in development for more than thirty years. Originally developed as a programming language for con- ducting statistical analysis, it has grown into a complex and powerful application with now uses both a graphical and a syntactical interface and provides dozens of functions for managing, analyzing, and presenting data . Its statistical capabilities alone range from simple perentages to complex analyses of variance, multiple regressions, and general linear models. You can use data ranging from simple inte- gers or binary variables to multiple response or logrithmic variables. spss also provides extensive data management functions, along with a complex and powerful programming language. In fact, a search at for spss books returns 2,034 listings as of March 15, 2004.
3 In these two sessions, you won't become an spss or data analysis guru, but you will learn your way around the program, exploring the various functions for manag- ing your data , conducting statistical analyses, creating tables and charts, and pre- paring your output for incorporation into external files such as spreadsheets and word processors. Most importantly, you'll learn how to learn more about spss . spss Step-by-Step 5. Installing the data Installing the data The data for this tutorial is available on floppy disk (if you received this tutorial as part of a class) and on the Internet. Use one of the following procedures to install the data on your computer. Installing files from the Internet Before you begin to download the files, create a new folder on your computer's hard disk named SPSST utorialData. When you download the files, you'll save them in this directory. 1. Go to Do not type www or http:// . 2. When prompted for a user name, enter: spss . 3. For the password, enter: tutorial.
4 4. To download each file, click it once, press Ctrl-C or select Edit > Copy from the menu. 5. Switch to a window for your computer and save the file in the directory named SPSST utorialData. To do so, open the folder and press Ctrl-V or select Edit >. Paste from the menu. 6. Once you have downloaded all the files, close the Internet browser. Installing files from the diskette 1. With the diskette in the floppy drive, open a window for the C drive on your computer (or any other drive where you want to save the data files). 2. Create a new folder named SPSST utorialData. 3. Copy the files from the floppy disk to the SPSST utorialData folder by copying and pasting or by dragging. Introducing the interface When you use spss , you work in one of several windows: the data view, the vari- able view, the output view, the draft output view, and the script view. Eventually you'll also use the syntax editor (think: code) to save or refine your queries. 6 spss Step-by-Step Introducing the interface The data view The data view displays your actual data and any new variables you have created (we'll discuss creating new variables later on in this session).
5 1. From the menu, select File > Open > data . 2. In the Open File window, navigate to C:\SPSST utorialData\Employee and open it by double-clicking. spss opens a window that looks like a standard spreadsheet. In spss , columns are used for variables, while rows are used for cases (also called records). 3. Press Ctrl-Home to move to the first cell of the data view. 4. Press Ctrl-End to move to the last cell of the data view. 5. Press Ctrl-Home again to move back to the first cell. The variable view At the bottom of the data window, you'll notice a tab labeled Variable View. The variable view window contains the definitions of each variable in your data set, including its name, type, label, size, alignment, and other information. 1. Click the Variable View tab. 2. Review the information in the rows for each variable. Note: While the variables are listed as columns in the data View, they are listed as rows in the Variable View. In the Variable View, each column is a kind of variable itself, containing a specific type of information.
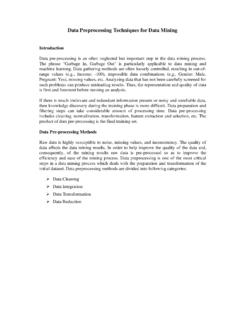
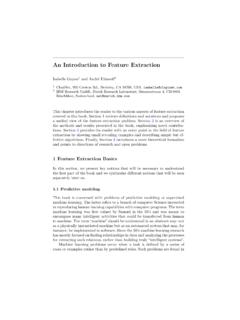
6 3. Click the data View tab to return to the data . 4. Double-click the label id at the top of the id column. Notice that double-clicking the name of a variable in the data view opens the variable view window to the definition of that variable. 5. Click the data view tab again. The output view The output window is where you see the results of your various queries such as fre- quency distributions, cross-tabs, statistical tests, and charts. If you've worked with Excel, you're probably used to seeing all your work on one page, charts, data , and calculations. In spss , each window handles a separate task. The output window is where you see your results. spss Step-by-Step 7. Introducing the interface Try it: 1. From the menu, select Analyze > Descriptive Statistics> Crosstabs. 2. Click once on Employment, then click the small right arrow next to Rows to move the variable to the Rows pane (Figure 1). FIGURE 1. Moving a variable to the Rows pane 3. Click Gender, then click the small right arrow next to Columns to move the Gender variable to the Columns pane.
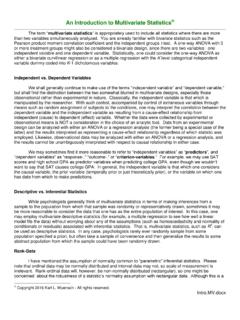
7 (Figure 2). 8 spss Step-by-Step Introducing the interface FIGURE 2. Selecting a column variable 4. Click Display clustered bar charts (Figure 3). FIGURE 3. Selecting clustered bar charts click here to display the clustered bar charts spss Step-by-Step 9. Introducing the interface 5. Click OK. spss brings the output window to the front displaying two tables and the clustered bar chart you requested. Take a moment to review the contents of the tables and the chart. Notice that the red arrow next to the title Crosstabs corresponds to the Crosstabs icon in the left pane of the window. The left pane displays the contents of the right pane and is a convenient method of moving around among the various output you'll be generating. Note: In some cases, you may see asterisks instead of numbers in a table cell. Asterisks indicate that the current column is too narrow to display the com- plete number. Widen the column by dragging its margin to the right. The draft view The draft view is where you can look at output as it is generated for printing.
8 The draft view does not contain the contents pane or some of the notations present in the output pane. Try it: 1. From the menu, select File > New > Draft Output. spss opens a Draft Output window that contains its own menu. 2. From the menu, select Analyze > Descriptive Statistics > Crosstabs. Notice that the dialog box opens with your previous selections. 3. Click OK. From here you can select charts or tables, copy them, and paste them into other applications like spreadsheets or word processors. Note: If you want to maintain the correct spacing of the tables, use a non-propor- tional font like Courier New. The syntax view spss has never lost its roots as a programming language. Although most of your daily work will be done using the graphical interface, from time to time you'll want to make sure that you can exactly reproduce the steps involved in arriving at certain conclusions. In other words, you'll want to replicate your analysis. The best method of preserving the exact steps of a particular analysis is the syntax view.
9 In the syn- tax view, you'll preserve the code used to generate any set of tables or charts. Syntax is basically the actual computer code that produces a specific output. It looks like this: 10 spss Step-by-Step Introducing the interface CROSSTABS. /TABLES=jobcat BY gender /FORMAT= AVALUE TABLES. /CELLS= COUNT. /BARCHART . In the code shown above, spss is instructed to create crosstabs, using the variable jobcat, sorting the crosstabs by gender using a specific format, to put a count into each cell, and then to create a corresponding barchart. Note: Preserving the steps you take in arriving at a conclusion is especially impor- tant if you are writing for publication, peer review, or any other situation in which others might want to test your conclusions. In the next steps, you'll create a simple chart and frequency distribution, save the syntax and then recreate the chart and frequency distribution by running the saved syntax. Try it: 1. From the menu, select Analyze > Descriptive Statistics > Crosstabs.
10 Notice that your previous selections are still present. 2. This time, instead of clicking OK, click Paste. 3. spss opens the Syntax Editor with the code you just pasted. When you select Paste instead of OK in dialog boxes like the Crosstabs box, the code generated by the function is pasted into the Syntax Editor. If you wanted, you could generate all your output from the syntax window alone. Gen- erally, however, you will probably work with your data and output until they are just the way you want them, then repeat the steps you took and paste the code into the syntax editor. You can then run the syntax at any time to recreate the output. 4. If the cursor is not already located somewhere in the syntax, click anywhere in the word CROSSTABS, then click the small right arrow on the toolbar or select from the menu Run > Current. spss opens the draft output window with the same chart you created using the menu commands. This time, however, you cre- ated the output by running the syntax (code) you created with the Paste func- tion.