Standard Normal Distribution Table
STANDARD NORMAL DISTRIBUTION: Table Values Re resent AREA to the LEFT of the Z score. 0.0 0.2 0.6 0.8 0.9 1.0 1.1 1.2 1.3 1.6 1.9 2.0 2.1 2.2
Information
Domain:
Source:
Link to this page:
Documents from same domain

SAMPLE RESIDENTIAL LEASE AGREEMENT
www.rit.eduSAMPLE Lease Agreement SAMPLE RESIDENTIAL LEASE ... the Lease Term in the condition in which ... Condition and Inventory Statement shall be completed during the ...
XIV. Accounting for Gifts, Endowment Earnings …
www.rit.eduAccounting for Gifts, Endowment Earnings and Other Projects ... RIT Accounting Practices, Procedures and ... Accounting will post the deposit to a general ledger ...
Accounting Practices, Procedures and Protocol
www.rit.eduIntroduction The Accounting Practices, Procedures & Protocol workshops are designed to familiarize employees with the “how-to’s” of RIT accounting…

Alkaline cleaner control and life extension
www.rit.eduNote that normally the water level would be higher such that the sparger tube would be half submerged and water would be flowing over the weir.

reative Thinking Definition - Rochester Institute of ...
www.rit.eduAn educational experience is often created to increase critical thinking and problem solving. Creative thinking is both the ability to combine or synthesize existing ideas, images, or expertise in original ways and the experience of thinking, reacting, and working in an imaginative way characterized

Concept Paper for a New Degree Program I. Master of ...
www.rit.eduAdditionally, the Construction Manager Certification Institute identifies six academic program areas beyond construction management as providing appropriate preparation for the discipline. These

2017–2018 UNDERGRADUATE COURSE DESCRIPTIONS
www.rit.edu2017–2018 UNDERGRADUATE COURSE DESCRIPTIONS. Undergraduate Course Descriptions 1 C cienc Technology College of Applied Science and Technology Index ... Course numbering: RIT courses are generally referred to by their alphanumeric registration label. The four alpha characters indicate the discipline within the college.

Osher Lifelong Learning Institute - Rochester Institute of ...
www.rit.eduOsher Lifelong Learning Institute Winter 2017 Course Catalog For Age 50+ Learners ON THE COVER: Carol Samuel, Bob Whelan, & Sue Meagher on a trip to Ireland (2016)

2018-2019 FRESHMAN PROSPECTUS
www.rit.eduRIT is a place where brilliant minds assemble and collaborate, where they pool together their individual talents across disciplines in service of big ideas and

VI. When to Use Transfer Journal Entries
www.rit.eduVI. When to Use Transfer Journal Entries A. Overview Transfer journal entries are used to move funds, rather than budget dollars, between project accounts or from an operating account to a project account.
Related documents
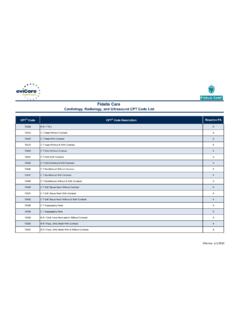
Cardiology, Radiology, and Ultrasound CPT Code List
www.evicore.com78230 Salivary Gland Imaging. X 78231. Serial Salivary Gland X. 78232 Salivary Gland Function Exam. X 78258. Esophogus Motility Study X. 78261 Gastric Mucosa Imaging. X.

Department of Energy's Qualified List of Energy Service ...
www.energy.govSan Antonio, TX 78230 P: 916-316-4864 Email: JKoizen@gmail.com : Facility Solutions Group (FSG) Bernard Erickson Executive Vice President 224 Washington Street Perth Amboy, NJ 08862 P: 732-826-6100 F: 732-284-4073 Email: bernie.erickson@fsgi.com Website: www.fsgi.com :

INSTITUCIONES BANCARIAS AUTORIZADAS PARA PAGO DE …
www.imss.gob.mxUMF 56 Jilotepec UMF 54 Apaxco HSBC El resto de UMF Edo. de Mex. Pte. Banamex Todas Michoacán Bancomer 75778 Todas Morelos Bancomer 82387 …