Transcription of 人 口 推 計 - stat.go.jp
1 30 2652 25 30 2659 23 15 1555 18 15 64 7580 57 65 3522 52 2463 38 30 ( ) 30 ( )June 1, 2018 (Provisional estimates)January 1, 2018 (Final estimates) Total population Total populationJapanese populationAge groups Both sexesMaleFemaleBoth sexesMaleFemaleBoth sexesMaleFemale Total12652 6156 6496 126,592 61,593 64,999 124,630 60,660 63,969 years old488 250 238 4,893 2,505 2,388 4,824 2,469 2,355 520 266 254 5,237 2,682 2,555 5,182 2,654 2,528 10 14541 277 264 5,427 2,779 2,648 5,380 2,754 2,625 15 19596 306 290 5,983 3,071 2,912 5,892 3,026 2.
2 866 20 24630 324 305 6,242 3,213 3,029 5,941 3,049 2,892 25 29626 321 305 6,253 3,203 3,050 5,979 3,054 2,926 30 34699 356 343 7,058 3,590 3,468 6,845 3,485 3,360 35 39776 393 383 7,829 3,967 3,862 7,643 3,885 3,758 40 44920 466 454 9,363 4,744 4,620 9,211 4,680 4,531 45 49959 484 475 9,513 4,807 4,707 9,363 4,749 4,614 50 54826 415 411 8,212 4,125 4,087 8,091 4,077 4,014 55 59763 381 382 7,618 3,799 3,818 7,529 3,763 3,766 60 64764 377 387 7,734 3,813 3,921 7,668 3,785 3,883 65 69953 461 492 9,796 4,736 5,060 9,744 4,712 5,032 70 74811 381 430 7,868 3,687 4,180 7,830 3,670 4,160 75 79680 304 376 6,737 3,009 3,728 6,711 2,997 3,713 80 84536 220 316 5,322 2,171 3,151 5,306 2,165 3,141 85 89350 122 228 3,431 1,188 2,243 3,423 1,185 2,237 90 94165 44 121 1,596 423 1,173 1,593 422 1.
3 171 95 9944 8 36 410 71 339 409 71 338 100 and over7166895968959 ( )Regrouped 15 Under1549 793 756 15,557 7,966 7,591 15,385 7,877 7,508 15 64years old7558 3823 3736 75,807 38,332 37,475 74,162 37,551 36,610 65 and over3545 1540 2005 35,228 15,296 19,933 35,083 15,232 19,851 75 and over1781 698 1083 17,564 6,872 10,692 17,509 6,850 10,659 85 and over565 174 391 5,505 1,692 3,813 5,493 1,688 3,805 Percentage distribution 15 15 64years 65 and 75 and 85 and ) , 27 Notes) Figures may not add up to the totals because of rounding.
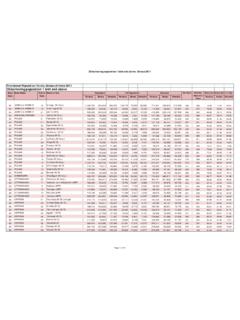
4 Based on the 2015 population Census. Final estimates for this month's population will be computed 5 months later using updated sources. population Estimates by Age (Five-Year Groups) and Sex population (Ten thousand persons) population (Thousand persons) 30 20 30 Reference Time Series of population Estimates ( Total population (Final estimates) 3) population change 4) 5)Net change Natural change Migration change 6)
5 Year and monthNatural NetNumberRateLive BirthsDeathschangeEntriesExitsmigration( 6)+(9) ( ) (4)-(5) (7)-(8) (1) (2) (3) (4) (5) (6) (7) (8) (9) 22 2010 128,057,3528) 23 2011 127,834,233 -223,119 1,073,663 1,256,387 -182,724 2,685,6812,764,665 -78,984 24 2012 127,592,657 -241,576 1,046,825 1,248,186 -201,361 2,756,7102,835,515 -78,805 25 2013 127,413,888 -178,769 1,044,983 1,276,719 -231,736 2,796,3842,782,006 14,378 26 2014 127,237,150 -176,738 1,022,371 1,274,085 -251,714 2,910,7932,874,407 36,386 27 2015 127,094,7458)
6 -142,405 1,025,105 1,300,537 -275,432 3,079,784 2,985,346 94,438 28 2016 126,932,772 -161,973 1,004,068 1,299,933 -295,865 3,361,4883,227,596 133,892 29 2017 126,706,210 -226,562 965,289 1,342,578 -377,289 3,615,119 3,464,392 150,727 28 2016 1 ,028,111 -14,371 79,401 123,326 -43,925 309,305 279,751 29,554 2 ,013,740 -66,109 78,354 115,014 -36,660 243,966 273,415 -29,449 3 ,947,631 27,839 82,527 116,400 -33,873 324,263 262,551 61,712 4 ,975,470 -50,684 79,999 105,489 -25,490 271,051 296,245 -25,194 5 May126,924,786 44,616 83,157 104,359 -21,202 279,789 213,971 65,818 6 June126,969,402 25,109 82,158 96,163 -14,005 255,070 215,956 39,114 7 July126,994,511 -18,247 85,846 99,399 -13,553 299,148 303,842 -4,694 8 ,976,264 -73,513 86,964 103,874 -16,910 354,324 410,927 -56,603 9 ,902,751 30,021 86,473 100,990 -14,517 304,314 259,776 44,538 10 ,932,772 4,727 84,738 109,985 -25,247 264,248 234,274 29,974 11 ,937,499 -19,710 79,740 114,349 -34,609 220,465 205,566 14.
7 899 12 ,917,789 -95,628 84,586 125,024 -40,438 289,479 344,669 -55,190 29 2017 1 ,822,161 -32,261 76,895 132,732 -55,837 364,995 341,419 23,576 2 ,789,900 -35,160 73,193 116,996 -43,803 246,035 237,392 8,643 3 ,754,740 6,044 79,750 120,687 -40,937 337,630 290,649 46,981 4 ,760,784 -37,092 76,504 108,663 -32,159 304,456 309,389 -4,933 5 May126,723,692 42,597 82,289 107,250 -24,961 298,016 230,458 67,558 6 June126,766,289 19,508 78,292 98,588 -20,296 275,386 235,582 39,804 7 July126,785,797 -30,980 81,665 102,450 -20,785 313,449 323,644 -10,195 8 ,754,817 -77,133 84,486 104,405 -19,919 378,663 435,877 -57,214 9 ,677,684 28,526 83,151 101,449 -18,298 322,297 275,473 46,824 10 ,706,210 8,093 82,994 110,785 -27,791 282,415 246,531 35,884 11 ,714,303 -19,673 79,013 116,080 -37,067 242,603 225,209 17,394 12 ,694,630 -102,741 84,436 127,168 -42,732 309,569 369,578 -60,009 30 2018 1 ,591,889 1) 10 2)
8 27 27 27 3) 10 4) ( ) 5) ( ) 6) ( : ) 7) 8) 9) ( ) 1)2) population as of 1st of each month Reference Time Series of population Estimates ( Japanese population (Final estimates) 3) population change 4) 5) 7)Net change Natural changeMigration change 6) Net increaseYear and monthNatural Netor decreaseNumberRateLive BirthsDeathschangeEntriesExitsmigrationb y change(15)+(18)
9 +(19) ( ) (13)-(14) (16)-(17)of nationality (10) (11) (12) (13) (14) (15) (16) (17) (18) (19) 22 2010 126,381,7289) 23 2011 126,209,681 -172,047 1,061,961 1,249,754 -187,793 798,792 826,503 -27,711 10,946 24 2012 126,022,681 -187,000 1,034,111 1,241,606 -207,495 887,670 910,828 -23,158 11,142 25 2013 125,802,643 -220,038 1,031,738 1,270,004 -238,266 903,217 926,289 -23,072 8,789 26 2014 125,561,810 -240,833 1,007,995 1,267,329 -259,334 928,759 952,213 -23,454 9,444 27 2015 125,319,2999)
10 -242,511 1,010,467 1,293,594 -283,127 948,338 949,299 -961 9,066 28 2016 125,020,252 -299,047 987,747 1,293,340 -305,593 961,652 963,739 -2,087 8,633 29 2017 124,648,471 -371,781 948,566 1,335,658 -387,092 976,144 971,918 4,226 11,085 28 2016 1 ,329,945 -111,670 78,233 122,719 -44,486 52,225 119,992 -67,767 583 2 ,218,275 -45,769 77,120 114,437 -37,317 61,519 70,692 -9,173 721 3 ,172,506 -7,900 81,115 115,789 -34,674 89,790 63,831 25,959 815 4 ,164,606 -54,633 78,690 104,953 -26,263 70,008 98,985 -28,977 607 5 May125,109,973 -18,488 81,746 103,841 -22,095 65,871 63,085 2,786 821 6 June125,091,485