Transcription of State and Local Government Employees: Where …
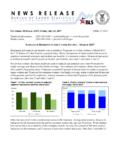
1 October 2008. State and Local Government Employees: Where Does California Rank? For latest update visit Estimates of State and Local Government employment for 2007 were just released by the Census Bureau ( ). This issue of Numbers in the News examines Where California ranks and how these estimates relate to ongoing debates about State budget choices. In 2007 California had the 2nd lowest number of full-time equivalent State Government employees relative to population among all states . California had 103 State employees for every 10,000 residents while Illinois had the lowest ratio at 97.
2 The average was 143 State employees per 10,000 residents. California's ratio of State Government employees relative to population was 28%. below the national average. Florida, Arizona and Nevada were also among the five states with the lowest ratios of State workers to population. Texas had 122 State employees per 10,000. residents. State Government Employees per 10,000. Residents in 2007. 200. 143. 150. 111 108 103 103. 97. 100. 50. 0.. s a a a a .S. oi ad on i id rn U. in or ev iz ifo Ill Fl Ar N. al C. When State and Local Government employees (including education) are added th together, California has the 4 lowest ratio of employees to population.
3 California had 487 State and Local full-time equivalent employees per 10,000. residents in 2007 compared to the national average of 544. Nevada was the State with the lowest ratio (430) followed by Arizona (474) and Pennsylvania (476). Michigan was the next lowest after California with 487 State and Local Government employees per 10,000 residents in 2007 while the ratio in Texas was 562. California's ratio was 11% below the national average. State and Local Government Employees per 10,000 Residents in 2007. 700. 544.
4 600. 487 484 476 474 430. 500. 400. 300. 200. 100. 0. a . da n a a .S. ni ga on i rn a va U. iz ev hi ifo yl Ar ic N. al s M. nn C. Pe K-12 education has the largest number of employees in most states . California th has the 6 lowest ratio of K-12 education employees to population. California is 18% below the national average in education employees relative to population despite the fact that California has an above-average percent of K-12 students in the State 's population. Texas ranks 5th highest among states with 272 K-12.
5 Employees per 10,000 residents. K-12 Education Employees per 10,000. Residents in 2007. 300. 225. 250. 184 184 184 179. 200 166 157. 150. 100. 50. 0. n . a n a e a .S. to go ad i r id rn wa U. ng or re ev ifo a Fl hi O. N. al el as C. D. W. Implications of the Data These data measure the staffing levels relative to population in California's State and Local governments including school districts. These data do not tell us how the lower staffing levels seen in California affect the delivery of services. There is broad agreement that seeking efficiencies in Government programs is good public policy.
6 Yet, the data suggest that at the aggregate level California is not overstaffed relative to caseloads in the major program areas. Indeed, a stronger case can be made that public programs are being carried out with less staffing than in most other states . Public agencies in California continue to face serious budget challenges as the weakening economy reduces revenues while most caseloads are still increasing. states and Local agencies face mid-year budget revisions and can look forward to a very challenging 2009-2010 budget year.
7 These data provide another confirmation that residents must face fundamental choices about the level of services they desire and are willing to pay for. The data do not support the idea that California can avoid difficult choices by eliminating excess Government employees. Technical Note The full-time equivalent employee data comes from the Census Bureau estimates for 2007 released on October 22, 2008 from the 2007 Census of Governments. The population estimates come from Census Bureau estimates for July 1, 2007. Note that the California population estimate prepared by the Census Bureau was million, which is million below the State Department of Finance (DOF) estimate of million, which was used for the above charts.
8 Using the DOF population estimate lowers the number of employees relative to population by approximately 3% compared to using the Census population estimate. Note also that using the DOF population estimate lowers the Census estimates of public spending per capita for California as well as lowering the Census estimate of per capita income for the State by approximately 3%. 132 Hamilton Avenue, Palo Alto, CA 94301-1616 phone (650) 321-8550