Transcription of STATE OF AIRPORT ECONOMICS - ICAO
1 ICAO - STATE of AIRPORT ECONOMICS Page 1 of 14 STATE OF AIRPORT ECONOMICS Infrastructure Management Programme Economic Development of Air Transport This STATE of AIRPORT ECONOMICS has been produced in cooperation with the Airports Council International (ACI). It presents an analysis on: 1. AIRPORT industry revenues and cost; 2. AIRPORT profit; 3. aeronautical and non-aeronautical charges; 4. single/dual/hybrid-till; and 5. public-private partnerships (PPPs). The economic figures and analyses are extracted from the 2014 - ACI AIRPORT ECONOMICS Report ( ) released in 2015. More comprehensive and detailed figures and analyses are available in the ACI report. Reference is also made to ICAO's Policies on Charges for Airports and Air Navigation Services (Doc 9082) and to the ICAO s AIRPORT ECONOMICS Manual (Doc 9562).
2 Important: in this STATE of AIRPORT ECONOMICS , 1) the word passengers refers to the total amount of those embarked and disembarked; and 2) aeronautical and non-aeronautical activities are based on ACI s definition, which defers from that of ICAO s. Data coverage of the 2014 - ACI AIRPORT ECONOMICS Report : ICAO - STATE of AIRPORT ECONOMICS Page 2 of 14 1 - AIRPORT INDUSTRY REVENUES AND COSTS Global AIRPORT revenues remained largely unperturbed based on results for the 2013 financial year in the face of the economic uncertainties and downside risks that have persisted across the world s markets. Aeronautical income, non-aeronautical income and non-operating income, which are the three components of a typical AIRPORT s income streams, all experienced sound growth rates in 2013 compared to the previous year.
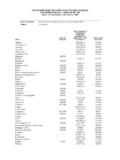
3 In essence, growth in key emerging market airports has circumvented the slowdown in the Euro area and other more mature markets. Industry income as a whole grew by per cent over 2012, reaching US$131 billion in 2013 (see table 1). On a regional basis, European airports hold the greatest proportion of global AIRPORT income (38 per cent). This is followed by asia and pacific (28 per cent) and North America (22 per cent). Although Europe holds a significant proportion of the world s AIRPORT revenues, it has experienced the weakest growth in overall revenues at per cent year over year. In particular, with the Euro-area downturn, non-aeronautical revenues grew only by per cent.
4 Notwithstanding, the region also experienced a decrease in total costs by per cent. Table 1: Estimated AIRPORT industry revenues and costs (millions of USD) in 2013 *Total revenue includes non-operating revenue **Aeronautical revenue includes ground-handling and terminal rental charges **Non-aeronautical revenue includes ground-handling concessions revenue source: ACI As expected, the regions with the highest growth in revenues also have the highest growth in passenger traffic. asia and pacific and the Middle East saw overall revenues increase by per cent and per cent respectively. However, the growth in cost varies markedly from one region to the next. The Latin America and the Caribbean region recorded the greatest gains in total cost2 from 2012-2013.
5 Graph 1: Distribution of total costs (2013) Source: ACI (ACI AIRPORT ECONOMICS Survey 2014) ICAO - STATE of AIRPORT ECONOMICS Page 3 of 14 Total AIRPORT costs can be divided between operating expenses and capital costs. Operating expenses make up 62 per cent of total costs, with the remaining proportion designated to capital cost (see graph 1). The largest component of operating expenses continues to be personnel costs, which account for 35 per cent. Contracted services, which are comprised activities outsourced to third parties, represent the second-largest component of operating expenses. These services make up 23 per cent of operating expenses.
6 Personnel costs refer to salaries, pensions and other employment costs relating to an AIRPORT s staff. The extent to which an AIRPORT chooses to operate essential services using its own employees (insourcing) or by contracting services out to third parties (outsourcing) will inevitaly affect the proportion of costs in the two main categories of operating expenses. Graph 2 presents the distributional breakdown of operating expenses. Graph 2: Distribution of operating expenses (2013) Source: ACI (ACI AIRPORT ECONOMICS Survey 2014) A facet of costs that has a significant impact on an AIRPORT s bottom line is capital costs. These costs include interest on outstanding debt and depreciation on AIRPORT infrastructure.
7 Where capital cost are taken into consideration within the overall cost structure, the significant weighting of depreciation as part of capital costs relative to operating expenses is indicative of the role that fixed assets and infrastructure play in the overall accounting of airports costs. Depreciation, which is the cost of a fixed asset allocated over time, makes up as much as 60 per cent of capital costs and more than one fifth of all costs and expenses incurred by a typical AIRPORT . In determining the cost basis for AIRPORT charges, the cost to be allocated is the full cost of providing the AIRPORT and its essential ancillary services, including appropriate amounts for cost of capital and depreciation of assets, as well as the costs of maintenance, operation, management and administration.
8 Consistent with the form of economic oversight adopted, these costs may be offset by non-aeronautical revenues (Doc 9082, Section 2, para. 2 i) refers)1. Graph 3 shows the breakdown of capital costs. 1 ICAO s guidance on how one may interpret paragraphs 2 i) in Section II of Doc 9082 with respect to the treatment of non-aeronautical revenues to offset AIRPORT aeronautical costs is presented in Table 4-6 of Doc 9562. ICAO - STATE of AIRPORT ECONOMICS Page 4 of 14 Graph 3: Distribution of capital costs (2013) Source: ACI (ACI AIRPORT ECONOMICS Survey 2014) ICAO - STATE of AIRPORT ECONOMICS Page 5 of 14 2 - AIRPORT PROFITS Airports may produce sufficient revenues to exceed all direct and indirect operating costs (including general administration, etc.
9 And so provide for a reasonable return on assets at a sufficient level to secure efficient financing in capital markets for the purpose of investing in new or expanded AIRPORT infrastructure and, where relevant, to remunerate adequately holders of AIRPORT equity (Doc 9082, Section 2, para. 2 viii) refers)2. AIRPORT size plays an important role in determining profitability. In order for airports to archieve economies of scale, evidenced by declining average cost curves, total costs need to be spread over the airports outputs (ie. passengers, cargo and movements). At a given AIRPORT , this can only be archieved with significant traffic throughput.
10 Consequently, smaller airports with fewer than one million passengers tend to have negative margins. Taking into consideration capital cost and taxes, graph 4 summarizes net profit margins by AIRPORT size. Graph 4: Net profit margins by AIRPORT size (2013) source: ACI (ACI AIRPORT ECONOMICS Survey (2014); adapted from Bloomberg (2015)) AIRPORT margins increase as AIRPORT markets expand in term of traffic, although a slight decrease in margins is observed for airports serving 25-40 million passengers per year. Finally, margins peak again for airports serving a market of more than 40 million passengers. On a global level, margins are at almost 16 per cent for the industry.