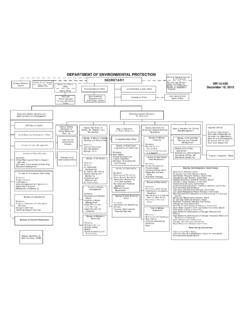
Transcription of State of Maine Department of Environmental …
1 State of Maine Department of Environmental protection 2016 Integrated Water Quality Monitoring and Assessment Report Final 2/28/2018 Maine Department OF Environmental protection 17 State House Station | Augusta, Maine 04333-0017 Babel Brook, Ebeemee TWP Maine Department of Environmental protection 2016 Integrated Water Quality Report Maine DEP 2016 305(b) Report and 303(d) List 2 Table of Contents Chapter 1 5 Data Sources and Acknowledgements .. 6 Chapter 2 Executive Summary, Public participation and Response to Comments .. 10 Executive Summary .. 10 Public Participation .. 14 Chapter 3 Background .. 19 State Atlas .. 19 Water Quality Standards 23 303(d) 23 Highlights for Point Source Pollution Control Programs.
2 26 The Maine NPS Water Pollution Control Program .. 31 Stormwater Programs .. 32 Land Use and Growth Management .. 34 Education and Outreach .. 34 The Environmental Impact and Economic & Social Costs/Benefits of Effective Water Quality Programs .. 35 Chapter 4 Surface Water Monitoring & Assessments .. 38 Assessment Methodology .. 38 Assessment Criteria .. 43 Integrated Report Lists of Categories 1 Through 5 .. 47 Rivers / Streams .. 55 Lakes / Ponds .. 67 Estuaries / Coastal Waters .. 74 Chapter 5 Wetlands .. 89 89 Development of Wetland Water Quality Standards .. 90 Integrity of Wetland Resources .. 92 Extent of Wetland Resources .. 94 Chapter 6 Groundwater Monitoring & Assessments.
3 97 Overview .. 97 Assessment of Groundwater Quality .. 98 Summary of Groundwater Quality .. 113 Chapter 7 Public Health-Related Assessments .. 118 Maine Healthy Beaches Program .. 118 Shellfish Growing Area Classification Program .. 122 Ocean Fish and Shellfish Consumption 123 Freshwater Fish Consumption Monitoring, Assessments and Advisories .. 125 Groundwater and Public Health Concerns .. 128 Chapter 8 Summary of Impaired Waters .. 132 Overview .. 132 New Listings .. 132 New Delistings .. 135 Status of Delisted Category 5 Waters .. 142 TMDL Development Status .. 170 Chapter 9 Accessing and Managing Data Used in Making Decisions on Status of Waters .. 185 Maine DEP Quality Management System.
4 185 Environmental and Geographic Analysis Database (EGAD) .. 185 Water Quality Monitoring and Reporting Utilizing GIS and the National Hydrography Dataset .. 186 Listings on Individual Waters .. 187 Cover photo: Babel Brook, Ebbeemee Township (DEP biological monitoring unit, 2016) Maine Department of Environmental protection 2016 Integrated Water Quality Report Maine DEP 2016 305(b) Report and 303(d) List 3 Index of Figures Figure 6-1 Active and Inactive Landfills in Maine ..106 Figure 6-2 Distribution of Sole Source Public Water Supply Wells for the Ambient Water Quality Monitoring Network by Aquifer Type ..113 Figure 6-3 Ambient Water Quality Monitoring Network Well Location Map.
5 114 Index of Tables Table 2-1 Summary of Changes to Surface Water Assessment Categories 2014 to 2016 ..11 Table 3-1 The 2012 Integrated Report State of Maine Atlas ..20 Table 3-2 Priority Waters Included in Maine s Vision ..24 Table 3-3 CSO Program Summary Statistics ..27 Table 3-4 Yearly Summary of SCGP Activities ..28 Table 3-5 Permitting/licensing by the Table 3-6 Maine s Regulated MS4s ..33 Table 3-7 319(h) Clean Water Act Grant Awards to Maine ..36 Table 3-8 Office of Innovation and Assistance Technical Assistance Efforts January 2, 2011 to December 30, 2012* ..37 Table 4-1 Maine Designated Uses and Attainment Criteria for Rivers and Streams1 ..43 Table 4-2 Maine Designated Uses and Attainment Criteria for Lakes and Ponds1.
6 44 Table 4-3 Maine Designated Uses and Attainment Criteria for Estuarine and Marine Waters ..44 Table 4-4 Lake Trophic State Parameters and Guidelines ..46 Table 4-5 Summary of State Waters Attaining and Not Attaining Standards ..48 Table 4-6 Individual Designated Use Support Summary for Maine Rivers and Streams ..49 Table 4-7 Individual Designated Use Support Summary for Maine Lakes ..49 Table 4-8 Individual Designated Use Support Summary for Maine Wetlands ..50 Table 4-9 Individual Designated Use Support Summary for Maine Estuarine and Marine Waters 50 Table 4-10 Total Sizes of Category 4 and 5 Impaired Maine Rivers and Streams by Listing Cause/Stressor Type ..51 Table 4-11 Total Sizes of Category 4 and 5 Impaired Maine Lakes by Listing Cause/Stressor Type (Total acreage).
7 51 Table 4-12 Total Sizes of Category 4 and 5 Impaired Maine Lakes by Listing Cause/Stressor Type (by Category) ..51 Table 4-13 Total Sizes of Category 4 and 5 Impaired Maine Wetlands by Listing Cause/Stressor Type ..52 Table 4-14 Total Sizes of Category 4 and 5 Impaired Maine Estuarine and Marine Waters by Listing Cause/Stressor Type ..52 Table 4-15 Total Sizes of Category 4 and 5 Impaired Maine Rivers and Streams by Source Category ..52 Table 4-16 Total Sizes of Category 4 and 5 Impaired Maine Lakes by Source Category ..53 Table 4-17 Total Sizes of Category 4 and 5 Impaired Maine Lakes by Source Category (by Listing Category) ..53 Table 4-18 Total Sizes of Category 4 and 5 Impaired Maine Wetlands by Source Category.
8 54 Table 4-19 Total Sizes of Category 4 and 5 Impaired Maine Estuarine and Marine Waters by Source Category ..54 Table 4-20 Maine Water Quality Criteria for Classification of Fresh Surface Waters (38 465) ..55 Table 4-21 Percent Distribution of River/Stream Water Classes ..56 Table 4-22 Summary of Changes to Surface Water Assessment Categories 2014 to 20161 ..57 Table 4-23 "All" and "Significant" Lake Category Information ..68 Maine Department of Environmental protection 2016 Integrated Water Quality Report Maine DEP 2016 305(b) Report and 303(d) List 4 Table 4-24 Summary of Listing Categories and Subcategories used in the 2016 Assessment of Maine Lakes ..68 Table 4-25 Individual Use Support Summary for Lake (acres) in Category 5A (TMDL Needed).
9 70 Table 4-26 Trophic Status of Maine Lakes ..71 Table 4-27 Lake Rehabilitation Technique Summary ( 319 Projects) ..71 Table 4-28 Maine s Estuarine and Marine Waters Classification Standards ..75 Table 4-29 Area and Percentage of Estuarine and Marine Waters in Each Table 5-1 Wetland Mitigation Totals in the Organized Townships ..95 Table 5-2 Permitted Wetland Impact Totals in the Organized Townships ..96 Table 6-1 Remediation Priority List Sites Number of Sites as of January 2013 ..101 Table 6-2 Current (January 2013) Remediation Priority List Sites Contamination Summary ..101 Table 6-3 Oil and Hazardous Material Reports - January 2011 through December 2012 ..103 Table 6-4 Number of Hazardous Substance Sites by Program and Status.
10 108 Table 6-5 Nitrate-N Frequency Distributions for Private Well Analyses ..109 Table 6-6 Wells testing positive for E. coli or total coliform, 1960 to August 2006 ..109 Table 6-7 Wells testing positive for E. coli or total coliform, January 2008 to December 2012 ..110 Table 6-8 Underground Injection Control Program Information ..110 Table 6-9 Ambient Aquifer Monitoring Data ..115 Table 7-1 Beaches Participating in Program ..119 Table 7-2 2011 Beach Advisory and Closure Information ..121 Table 7-3 2012 Beach Advisory and Closure Information ..121 Table 8-1 New Rivers/Streams Listings ..132 Table 8-2 New Lakes/Ponds Listings ..133 Table 8-3 New Wetlands Listings ..133 Table 8-4 New Estuarine/Marine Waters Listings.
