Transcription of State of the Homeless 2020 - Arizona
1 State of the Homeless 2020 homelessness in Arizona annual Department of Economic Security report State OF THE Homeless 2020 homelessness in Arizona annual report Arizona Department of Economic Security Michael Wisehart, Director December 31, 2020 Prepared by: Page | 2 Homeless Coordination Office Arizona Department of Economic Security Division of Adult and Aging Services Executive Summary Arizona , like much of the country, is continuing work to prevent and mitigate homelessness in both rural and urban communities.
2 While the factors that lead to homelessness are varied and complex, there are many consistent and identifiable contributing factors for both individuals and families in urban and rural communities. For individuals, conditions such as physical and behavioral health issues, domestic violence, and substance abuse contribute to homelessness . On the community side, there are not enough affordable homes to house everyone in need. Diverse strategies, approaches, and coordination are necessary to assist individuals experiencing homelessness .
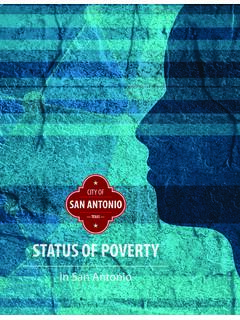
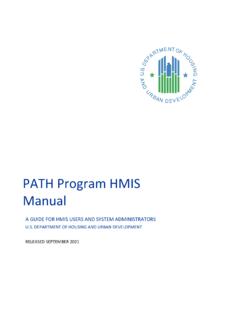
3 The community benefited from the advent of Rapid Rehousing in 2009. There was a steep decline in people experiencing homelessness when that intervention became available. While the trend has not returned to the previous levels, homelessness rates are increasing, indicating continued work and interventions are needed, and our work is not done. Figure 1; is showing the last 15 of homelessness in each Continuum of Care (COC) and the total of statewide data. In 2009, Rapid Rehousing became a new intervention.
4 In 2009/2010, the chart shows a steep decline in people experiencing homelessness . In State Fiscal Year (SFY) 2020, the Department of Economic Security (DES) Homeless Coordination Office provided over 12,547 at-risk and individuals experiencing homelessness with services and/or interventions, through contracted vendors. DES has contracted Homeless interventions in ten of the fifteen counties throughout Arizona and strives to provide Homeless services to every area in need. The massive impact of COVID-19 has significantly impacted the Homeless population.
5 Homeless communities typically tend to be communal living styles. There is less access to quality health care and low ability to socially distance, making it the ideal breeding ground for illness and disease. At the time of this report , COVID-19 is still in full force, the full effect yet to be known. Arizona DES Homeless Coordination Office Page | 3 The annual report on homelessness in Arizona has been prepared pursuant to 41-1954 (A) (19) (g) and provides information about homelessness in Arizona during SFY 2020.
6 This report endeavors to show trends, successes, population, demographic characteristics, and subgroups that the Homeless population is composed of in the State of Arizona . It also shows the similarities and differences in the issues that impact homelessness in the three Continuums of Care (COCs). In Arizona , the State s Homeless services are divided into three service areas which are referred to as COCs. Arizona s three COCs are; Maricopa Regional Continuum of Care which encompasses all of Maricopa County, Tucson Pima Collaboration to End homelessness (TPCH) encompassing Pima County, and the Balance of State (BOS) covering the remaining thirteen (13) counties of the State .
7 Information and data for this report are derived from the following sources: annual Point-In-Time (PIT) surveys, conducted January 28, 2020; The State s three COC s aggregate reports from the Homeless Management Information System (HMIS); and Contract reports submitted to the DES Homeless Coordination Office. All references to SFY 2020 refer to the time frame of July 1, 2019 through June 30, 2020. Statewide Data In Arizona , Homeless service providers and funding agencies utilize Wellsky software for their HMIS data to manage and store data on individuals and families experiencing homelessness .
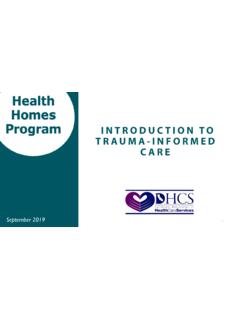
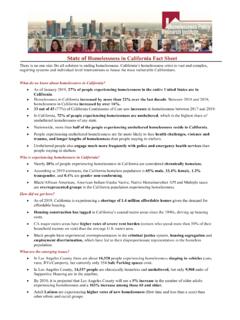
8 Homeless service providers enter data into HMIS which is then compiled into reports of aggregate data to be reviewed by planning committees, funding agencies, and the United States ( ) Department of Housing and Urban Development (HUD). Homeless service providers and funding agencies use the Homeless data to adjust services to meet the needs of the Homeless within each community. HUD further analyzes HMIS information to adjust federal funding to fill service gaps in communities nationwide and compiles the data to provide nationwide reports and statistics on homelessness in the Table 1 illustrates the estimated Arizona Census population in 2018 for each continuum and the 2020 HMIS estimated total number of individuals that are Homeless in each continuum.
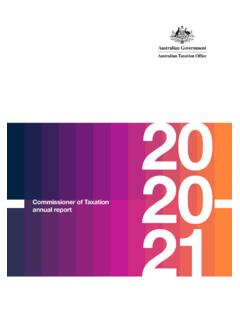
9 Continua Census Population PIT # Homeless % of Population Maricopa Regional COC 4,485,414 7,419 Balance of State 1,746,024 2,236 TPCH 1,047,279 1,324 Totals 7,278,717 10,979 PIT Count The PIT count is intended to be an unduplicated count of Homeless individuals and families, both sheltered and unsheltered, on one night, every January. The count is conducted to acquire an estimated number of individuals that are Homeless at a point in time in each community. PIT counts are conducted by Homeless programs across the After the results are calculated, HUD requires the COCs to send the results to HUD for review.
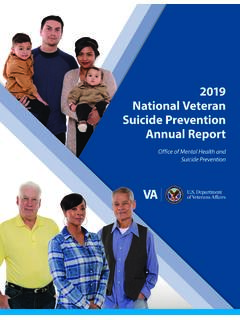
10 Figure 2 depicts Sheltered PIT totals from the three continuums over a three-year period. Page | 4 Figure 2A depicts Unsheltered PIT totals from the three continuums over a three-year period. Veteran PIT Estimates During the annual PIT count in 2020, there were 921 veterans identified as experiencing homelessness statewide. Over the last three years, the number of veterans in TPCH and BOS has decreased. The number of veterans in Maricopa County increased slightly over the three-year period. The decrease in Homeless veterans may be a result of the Supportive Services for Veteran Families (SSVF) funding awarded to Arizona service providers as well as the Veterans Affairs Supportive Housing (VASH) voucher program administered by several public housing agencies.