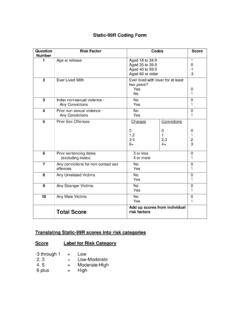
Transcription of STATIC-99R STATIC-2002R Evaluators’ WORKBOOK
1 1 STATIC-99R & static - 2002r Evaluators WORKBOOK Amy Phenix, L. Maaike Helmus, & R. Karl Hanson October 19, 2016 This version updates and replaces the January 1, 2015 STATIC-99R & static - 2002r Evaluators WORKBOOK and all other previous versions. From the 2015 version, a new section has been added on the updated nominal risk categories, and tweaks have been made to phrasing and references. All normative data ( , recidivism estimates, risk ratios, percentiles) remain unchanged from the 2015 version. RDIMS 661841-V82 TABLE of CONTENTS WHAT S NEW IN 2016 .. 3 Revised Risk Levels .. 3 Estimates of Violent and General Recidivism Risk .. 5 WHAT WAS NEW IN 2015 .. 5 Percentiles .. 6 Relative Risk Ratios .. 7 STATIC-99R Recidivism Estimates .. 8 static - 2002r Recidivism Estimates .. 10 Samples Used To Construct Percentile Ranks .. 12 Samples Used To Construct Risk Ratios for STATIC-99R and static - 2002r .. 15 STATIC-99R Summary List of Samples for Recidivism Tables.
2 19 STATIC-99R Sample Descriptions for Recidivism Tables .. 20 static - 2002r Summary List of Samples for Recidivism Tables .. 23 static - 2002r Sample Descriptions for Recidivism Tables .. 24 Report Writing Templates for STATIC-99R and static - 2002r .. 26 38 static Supplementary Recidivism Tables .. 45 3 WHAT S NEW IN 2016 Revised Risk Levels In the original static -99, total scores would translate into one of four risk categories: low, moderate-low, moderate-high, and high. For static -2002, scores translated into one of five risk categories: low, low-moderate, moderate, moderate-high, and high. When the scales were revised (creating STATIC-99R and static - 2002r ), we did not revise the cut-off scores for the risk categories. Our hope was that after completing our analyses on the other normative data for the scale (percentiles, risk ratios, and absolute recidivism estimates), we would revisit the risk categories to determine if they needed a change.
3 As of 2016 , we concluded that they did. We recommend that where the old STATIC-99R and static - 2002r risk categories are used, the new levels should replace them, as they are based on stronger empirical and conceptual grounds. The revisions to the risk levels are also part of a broader movement towards improved risk communication. The status quo in risk assessment has been for scale developers to translate total scores into risk levels in ways that were poorly defined and difficult to compare across measures. Consequently, it was common for similar scales to place the same offenders in different risk categories (Barbaree, Langton, & Peacock, 2006; Jung, Pham, & Ennis, 2013; Mills & Kroner, 2006). Compounding this confusion, it was also common for professionals to have very different interpretations of what labels like low, moderate, and high risk mean (Hilton, Carter, Harris, & Sharpe, 2008; Monahan & Silver, 2003; Slovic, Monahan, & MacGregor, 2000).
4 We believe that the way forward in risk assessment will involve the development of universal, non-arbitrary risk levels. Such categories should ideally describe psychologically meaningful characteristics of the individual (not the scale), be linked to realistic options for action, be evidence-based, applicable to all risk scales, use a simple professional language, and be easy to implement across diverse jurisdictions, scales, and offenders. As part of this broader goal, the United States Council of State Governments Justice Center has assembled a working group to develop standardized risk levels for general offenders (Hanson, Bourgon et al., 2016 ). This working group includes two members of the static development team (R. Karl Hanson & Kelly Babchishin). The Justice Center has currently proposed five broad risk levels for general reoffending. The lowest risk category (Level I) would be generally prosocial individuals who have nonetheless committed crime.
5 They would not be expected to have the criminal backgrounds, criminogenic needs, or the prognosis typical of offenders. The recidivism rates of Level I offenders would be indistinguishable from the rates of spontaneous offending among non-offenders ( , young males). Level II would be higher risk than non-offenders, but lower risk than typical offenders. It is expected that Level II offenders would have some 4 criminogenic needs, but that these life problems would be few and transient. Level III offenders would be the typical offenders in the middle of the risk distribution. Typical offenders have criminogenic needs in several areas, and require meaningful investments in structured programming to decrease their recidivism risk. Level IV offenders would be perceptibly higher risk than the typical offender. Most of these offenders would have chronic histories of rule-violations, poor childhood adjustment, and significant criminogenic needs across multiple domains.
6 The Justice Center s framework also included a fifth category for the highest risk offenders, defined as those virtually certain to reoffend. Level V offenders are those typically found in high security units, where considerable resources are devoted to managing current antisocial behaviour. The new risk levels for STATIC-99R and static - 2002r were developed in line with the Justice Center s proposed risk levels and informed by empirically based risk communication metrics (percentiles, risk ratios, and recidivism estimates; for further explanation of the new categories, see Hanson, Babchishin, Helmus, Thornton, & Phenix, 2016 ). Given that the Justice Center s standardized risk levels were based on general offending, not sexual offending, the new static levels made two significant deviations from the Justice Center s proposed categories. Firstly, we defined Level I offenders as those whose sexual recidivism rates are generally indistinguishable from non-sex offenders with no known history of sex offending.
7 In other words, this is a group whose risk of sexual reoffending is not different from other offenders in the criminal justice system who are not considered sex offenders. Secondly, given the low base rates of sexual recidivism, we are not currently able to empirically identify a group of sex offenders who are virtually certain to reoffend. Consequently, no STATIC-99R or static - 2002r scores meet the definition of a Level V offender. However, it is possible to distinguish two groups who are meaningfully higher risk than Level III offenders. Consequently, we have labelled the two highest risk levels as Level IVa and Level IVb. The revised STATIC-99R risk categories are as follows: Level I Very low risk (Scores of -3 to -2) Level II Below average risk (Scores of -1 to 0) Level III Average risk (Scores of 1 to 3) Level IVa Above average risk (Scores of 4 to 5) Level IVb Well above average risk (Scores of 6+) The revised static - 2002r risk categories are as follows: Level I Very low risk (Scores of -2 to -1) Level II Below average risk (Scores of 0 to 1) Level III Average risk (Scores of 2 to 4) Level IVa Above average risk (Scores of 5 to 6) Level IVb Well above average risk (Scores of 7+) 5 We recognize that evaluators tend to prefer labels for risk levels ( , very low risk ) and we have provided them above.
8 However, we also encourage evaluators to recognize biases, heuristics, and emotional reactions that are inherent in such common language terms. Consequently, we encourage evaluators to use Level I (and so forth) either instead of or in addition to the labels for each level. The language of Levels has the advantage of consistency with the Justice Center s proposed definitions, and hopefully will become a common language used across diverse risk scales. Although these are the new risk levels for STATIC-99R and static - 2002r , we recognize that risk categories are most useful when they are meaningfully linked to decisions ( , treatment or supervision resource allocation). Consequently, it is possible that some jurisdictions may develop their own risk categories to maximize the utility of STATIC-99R or static - 2002r for their decision-making purposes. For example, if a jurisdiction wants to refer the 10% highest risk offenders for high-intensity treatment, then it may make sense to create a high risk category defined by the top 10% of scores (using percentiles).
9 Alternately, matching offenders to tiered services may necessitate reducing the five risk categories to three (if so, we would recommend clumping the first two categories together and the last two categories together). When evaluators or jurisdictions develop their own risk categories linked to specific policy actions, we recommend that when different words are used to describe site specific levels (different from the standard language proposed above), and when the site specific levels are identified as different from those proposed by the static development team, that the definition of the site specific risk categories are clearly described in the report. Estimates of Violent and General Recidivism Risk STATIC-99R and static - 2002r are intended to provide information on risk for sexual recidivism only. To comment on the risk for violent or general recidivism among sex offenders, we recommend using the BARR- 2002r , which can be scored from static - 2002r items (see Babchishin et al.)
10 , 2016 ). WHAT WAS NEW IN 2015 The 2015 evaluator WORKBOOK presented and summarized new absolute recidivism estimates. Those estimates are unchanged in this version. For a more detailed description of those recidivism estimates (beyond the summary of the samples included, which appears later) and how they differ from earlier recidivism estimates for the scale, you may want to refer to the 2015 version of the evaluator WORKBOOK ( , under the norms tab) or the full paper describing the development of the estimates (Hanson, Thornton, Helmus, & Babchishin, 2016 ). 6 Estimated Percentiles for Canadian Sex Offenders STATIC-99R Score Percentile Rank defined as mid-point average Observed Percentages Percentile 95% CI Below Same Higher -3 0 0 -2 -1 0 1 2 3 4 5 6 7 8 9 10+ 0 static - 2002r Score Percentile Rank defined as mid-point average Observed Percentages Percentile 95% CI Below Same Higher -2 0 0 -1 0 1 2 3 4 5 6 7 8 9 10 11 12+ 0 Source.