Transcription of Statistical Analysis 2: Pearson Correlation
1 1 Statistical Analysis 2: Pearson Correlation Research question type: Relationship between 2 variables What kind of variables? Continuous (scale/interval/ratio) Common Applications: Exploring the relationship (linear) between 2 variables; eg, as variable A increases, does variable B increase or decrease? The relationship is measured by a quantity called Correlation Example 1: A dietetics student wanted to look at the relationship between calcium intake and knowledge about calcium in sports science students. Table 1 shows the data she collected.
2 Table 1: Dietetics study data Respondent number Knowledge score (Out of 50) Calcium intake (mg/day) Respondent number Knowledge score (Out of 50) Calcium intake (mg/day) 1 10 450 11 38 940 2 42 1050 12 25 733 3 38 900 13 48 985 4 15 525 14 28 763 5 22 710 15 22 583 6 32 854 16 45 850 7 40 800 17 18 798 8 14 493 18 24 754 9 26 730 19 30 805 10 32 894 20 43 1085 Research question: Is there a relationship between calcium intake and knowledge about calcium in sports science students? Hypotheses: The 'null hypothesis' might be: H0: There is no Correlation between calcium intake and knowledge about calcium in sports science students (equivalent to saying r = 0) And an 'alternative hypothesis' might be: H1: There is a Correlation between calcium intake and knowledge about calcium in sports science students (equivalent to saying r 0), Data can be found in W:\EC\STUDENT\ MATHS SUPPORT CENTRE STATS WORKSHEETS\ Steps in SPSS (PASW): Step 1.
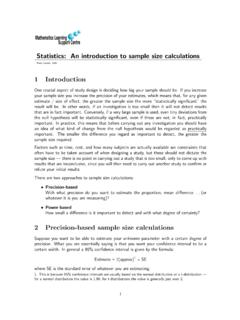
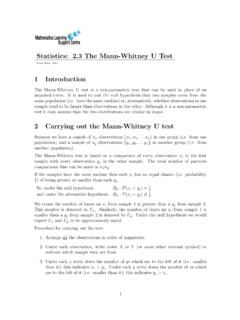
3 Draw a scatter plot of the data to see any underlying trend in the relationship: 2 Loughborough University Mathematics Learning Support Centre Coventry University Mathematics Support Centre A scatter plot can be drawn in MS Excel or in SPSS, as right, using the Graphs> Chart Builder options - choose Scatter/Dot - drag the Simple Scatter plot into the plotting region - drag the required variables into the two axes boxes - click OK [Note that the chart has been edited in the Chart Editor]. In this example there is perhaps an underlying assumption that 'calcium intake' quantity is in response to the amount of 'knowledge'.
4 It can be perceived from the scatter plot that the points are reasonably closely scattered about an underlying straight line (as opposed to a curve or nothing), so we say there is a strong linear relationship between the two variables. The scatter plot implies that as the knowledge score increases so the calcium intake increases. This shows a positive linear relationship. Pearson 's coefficient of linear Correlation is a measure of this strength. Pearson 's Correlation coefficient can be positive or negative; the above example illustrates positive Correlation one variable increases as the other increases.
5 An example of negative Correlation would be the amount spent on gas and daily temperature, where the value of one variable increases as the other decreases. Pearson 's Correlation coefficient has a value between -1 (perfect negative Correlation ) and 1 (perfect positive Correlation ). If no underlying straight line can be perceived, there is no point going on to the next calculation. Step 2: Calculating the Correlation coefficient With the data in the Data Editor, choose Analyze > Correlate > - Select the 2 variables to be correlated in this case calcium intake and knowledge score into the Variable list - Ensure the Pearson Correlation Coefficients box is ticked - Click OK 3 Output should look something like: correlations Knowledge score (out of 50) Calcium intake (mg/day) Knowledge score (out of 50) Pearson Correlation 1.
6 882** Sig. (2-tailed) .000 N 20 20 Calcium intake (mg/day) Pearson Correlation .882** 1 Sig. (2-tailed) .000 N 20 20 NB The information is given twice. Results: From the correlations table, it can be seen that the Correlation coefficient (r) equals , indicating a strong relationship, as surmised earlier. p < [NEVER write p = ] and indicates that the coefficient is significantly different from 0. Conclusion: We can conclude that for sports science students there is evidence that knowledge about calcium is related to calcium intake.
7 In particular, it seems that the more a sports science student knows about calcium, the greater their calcium intake is (r = , p < ). Note: We CANNOT readily assume that knowledge about calcium CAUSES an increase in calcium intake Comments: - Validity of Pearson Correlation calculations are based on several assumptions: o data is at continuous (scale/interval/ratio) level o data values are independent of each other; ie, only one pair of readings per participant is used o a linear relationship is assumed when calculating Pearson 's coefficient of Correlation o observations are random samples from normal or symmetric distributions - Other coefficients can be calculated for data at ordinal level of measurement.
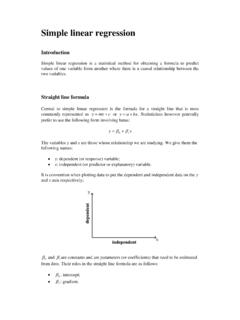
8 O Kendall's ('tau') measures the degree to which a relationship is always positive or always negative o Spearman's coefficient of rank Correlation , ('rho') behaves in a similar way to Kendall's , but has less direct interpretation - A relationship between two variables does not necessarily imply causation. Could a third variable be involved? - As sample size increases, so the value of r at which a significant result occurs, decreases. So it is important to look at the size of r, rather than the p-value. A value of r below is 'weak' - Conclusions are only valid within the range of data collected.
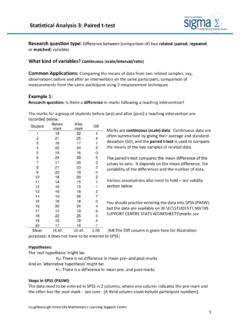
9 P-value Pearson 's Correlation coefficient, r number of pairs of readings 4 Example 2: A Correlation coefficient of (p < ) was calculated for 18 data pairs plotted in the scatter graph in figure A, right. A Pearson Correlation coefficient of (p = ) was calculated for the 27 data pairs plotted in the scatter graph in figure B below. Comment on the pattern of dots and these results. Would you have calculated Correlation coefficients for A and B? See below for some suggestions. Example 3: Data were collected from a group of students to investigate the relationship between their shoe size (European) and their forearm length (cm).
10 Using the data provided in W:\EC\STUDENT\ MATHS SUPPORT CENTRE STATS WORKSHEETS\ explore this relationship. Note that there are some missing values coded 888, and some anomalous data readings. Example 4: In the above data set would it be sensible to calculate a Pearson Correlation coefficient for age and shoe size? Suggested Answers Example 2: No neither chart shows an underlying straight line! A: cover-up the three points in the bottom left what do you see? B: the points 'fan-out' as values increase ie showing greater variability for larger values Example 3: Assuming the data is at the appropriate level, a scatterplot shows an underlying straight line, although the points are widely spread out.