Transcription of Statistical analysis of genome-wide association …
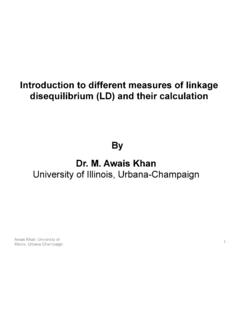
1 Statistical analysis of genome-wide association (GWAS) dataJim StankovichMenzies Research InstituteUniversity of Introduction Confounding variables and linkage disequilibrium Statistical methods to test for association in case-control GWAstudies Allele counting chi-square test Logistic regression Multiple testing and power Example: GWAS for multiple sclerosis (MS) Data cleaning / quality control ResultsGWA studies have been very successful since 2007 Prior to the advent of GWA studies, there was very little success inidentifying genetic risk factors for complex multifactorial diseases GWA studies have identified over 200 separate associations withvarious complex diseases in the past two years Human Genetic Variation hailed as Breakthrough of the Year byScience magazine in 20072000 Human genome project200120022003200420052006200720082 009 The SNP consortiumThe International HapMap ProjectSNP genotyping arraysGWA studiesThis talk.
2 Case-control GWA studies Obtain DNA from people with disease of interest (cases) andunaffected controls Run each DNA sample on a SNP chip to measure genotypes at300,000-1,000,000 SNPs in cases and controls Identify SNPs where one allele is significantly more common incases than controls The SNP is associated with diseaseSNP: rs12425791strokeThis talk: case-control GWA studies Obtain DNA from people with disease of interest (cases) andunaffected controls Run each DNA sample on a SNP chip to measure genotypes at300,000-1,000,000 SNPs in cases and controls Identify SNPs where one allele is significantly more common incases than controls The SNP is associated with disease Alternative strategy (Peter Visscher s talk):test for association between SNPs and a quantitative trait thatunderlies the disease (endophenotype)SNP.
3 Rs12425791strokeblood pressureAssociation does not imply causation Suppose that genotypes at a particular SNP are significantlyassociated with disease This may be because the SNP is associated with some other factor(a confounder), which is associated with disease but is not in thesame causal pathwaySNP near lactase genemultiple sclerosis (MS) association does not imply causation Suppose that genotypes at a particular SNP are significantlyassociated with disease This may be because the SNP is associated with some other factor(a confounder), which is associated with disease but is not in thesame causal pathwaySNP near lactase geneNorthern Europeanancestrymultiple sclerosis (MS)
4 association does not imply causation Suppose that genotypes at a particular SNP are significantlyassociated with disease This may be because the SNP is associated with some other factor (aconfounder), which is associated with disease but is not in the samecausal pathway Possible confounders of genetic associations: Ethnic ancestry Genotyping batch, genotyping centre DNA quality Environmental exposures in the same causal pathway Nicotine receptors --> smoking --> lung cancerHung et al, Nature 452: 633 (2008) + other articles in same issue Alcohol dehydrogenase genes --> alcohol consumption --> throat cancerHashibe et al, Nature Genetics 40: 707 (2008)Helpful confounding.
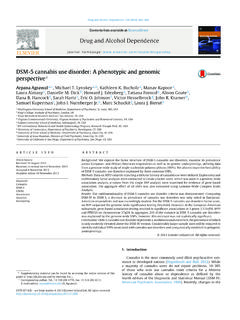
5 Linkage disequilibriumLinkage disequilibrium (LD) is the non-independence of alleles atnearby markers in a population because of a lack of recombinationsbetween the markers50,000 years ago:Today:~50kb Haplotype block Direct and indirect association testingFunctional SNP is genotypedand an association is foundFunctional SNP (blue) is notgenotyped, but a number ofother SNPs (red), in LD withthe functional SNP, aregenotyped, and anassociation is found for theseSNPsHirschhorn and Daly: Nature Reviews Genetics 6: 95 (2005)LD is helpful, because not all SNPs have to be genotypedPe er et al: Nature Genetics 38.
6 663 (2006)Allele counting to test for association between SNPgenotype and case / control statusGGGTTTT otalCasesr0r1r2 RControlss0s1s2 STotaln0n1n2 NGTT otalCases2r0+r1r1+2r22 RControls2s0+s1s1+2s22 STotal2n0+n1n1+2n22 NObserved allele countsAllele counting to test for association between SNPgenotype and case / control statusGGGTTTT otalCasesr0r1r2 RControlss0s1s2 STotaln0n1n2 NGTT otalCases2r0+r1r1+2r22 RControls2s0+s1s1+2s22 STotal2n0+n1n1+2n22 NGT2R(2n0+n1)/(2N)2R(n1+2n2)/(2N)2S(2n0+ n1)/(2N)2S(n1+2n2)/(2N)Observed allele countsExpected allele countsAllele counting to test for association between SNPgenotype and case / control statusGGGTTTT otalCasesr0r1r2 RControlss0s1s2 STotaln0n1n2 NGTT otalCases2r0+r1r1+2r22 RControls2s0+s1s1+2s22 STotal2n0+n1n1+2n22 NChi-square test for independence of rows and columns (null hypothesis).
7 (Obs Exp)2 Exp ~ 2 with 1 dfGT2R(2n0+n1)/(2N)2R(n1+2n2)/(2N)2S(2n0 +n1)/(2N)2S(n1+2n2)/(2N)Observed allele countsExpected allele countsPLINK --assoc option Other options ( dominant/recessive models) --modelThe odds ratio: a measure of effect sizeGTCasesabControlscdAllele countsConsider all the G alleles in the sample, and pick one at odds that the G allele occurs in a case: a/cConsider all the T alleles in the sample, and pick one at odds that a T allele occurs in a case: b/dodds ratio = odds that G allele occurs in a case = a/c = a d odds that T allele occurs in a case b/d b cOdds of an event occurring = Pr(event occurs) / Pr(event doesn t occur) = Pr(event occurs) / [1 - Pr(event occurs)]Interpretation of the odds ratioGTCasesabControlscdOR = increase in odds of being a case for each additional G alleleOR = 1.
8 No association between genotype and diseaseOR > 1: G allele increases risk of diseaseOR < 1: T allele increases risk of diseaseIf the disease is rare ( ~ for MS), the odds ratio is roughly equal tothe genotype relative risk (GRR):the increase in risk of disease conferred by each additional G if OR = , Pr(MS | TT) = Pr(MS | GT) = Pr(MS | GG) = odds ratio (OR) = odds that G allele occurs in a case = a d odds that T allele occurs in a case b cLogistic regression.
9 More flexible analysis for GWA studies Similar to linear regression, used for binary outcomes instead ofcontinuous outcomes Let Yi be the phenotype for individual iYi = 0 for controlsYi = 1 for cases Let Xi be the genotype of individual i at a particular SNPTTXi = 0 GTXi = 1 GGXi = 2 Logistic regression: more flexible analysis for GWA studies Similar to linear regression, used for binary outcomes instead ofcontinuous outcomes Let Yi be the phenotype for individual iYi = 0 for controlsYi = 1 for cases Let Xi be the genotype of individual i at a particular SNPTTXi = 0 GTXi = 1 GGXi = 2 Basic logistic regression modelLet pi = E(Yi | Xi), expected value of pheno given genoDefine logit(pi) = loge[pi /(1- pi) ]Logistic regression.
10 More flexible analysis for GWA studies Similar to linear regression, used for binary outcomes instead ofcontinuous outcomes Let Yi be the phenotype for individual iYi = 0 for controlsYi = 1 for cases Let Xi be the genotype of individual i at a particular SNPTTXi = 0 GTXi = 1 GGXi = 2 Basic logistic regression modelLet pi = E(Yi | Xi), expected value of pheno given genoDefine logit(pi) = loge[pi /(1- pi) ]logit(pi) ~ 0 + 1 XiLogistic regression: more flexible analysis for GWA studies Similar to linear regression, used for binary outcomes instead ofcontinuous outcomes Let Yi be the phenotype for individual iYi = 0 for controlsYi = 1 for cases Let Xi be the genotype of individual i at a particular SNPTTXi = 0 GTXi = 1 GGXi = 2 Basic logistic regression modelL