Transcription of Statistical estimation using confidence intervals
1 6 Statistical estimation using confidenceintervalsIn Chapter 2, the concept of the central nature and variability of dataand the methods by which these two phenomena may be mathematicallydetermined were described. As previously explained, one of the mainpurposes for calculating the central nature ( the mean) and the vari-ability ( the standard deviation) of a set of sample data is to gain anunderstanding of the corresponding population statistics. In otherwords, the mean ( ) and standard deviation (s) of sample data areemployed to estimate the true (population) mean and true (population)standard deviation. However, it is reasonable to ask, how reliable arethe sample data at representing the population data?
2 Is the sample dataa good estimation of the population data? The concept of confidence intervalsAfter calculating the mean and standard deviation of a sample, as is thenormal approach in the pharmaceutical and related sciences, we need toprovide an indication of the reliability of the data. For example, in aclinical trial (N#20 patients) the volume of urine produced after theadministration of a new diuretic drug has been calculated as light of the small sample size, it is unreasonable to predict that thepopulation mean and standard deviation will be identical to theseobserved sample values, as each sample will produce different mean andstandard deviation values. Therefore, when reporting the mean ofsample data it is good practice to present some indication of the relia-bility of the data, the quality of the estimation of the true mean fromthe sample mean.
3 This is performed using confidence intervals . The con-fidence intervals are quoted as a mean and range (interval), the latterrepresenting the probability of observing the true mean. The imposedprobability is chosen by the person responsible for the Statistical manip-ulation of data; however, the most frequently employed confidenceintervals are 90%, 95% and 99%. confidence intervals are demonstrated graphically in Figures In these, 10 samples, each containing 10 observations, wereKX 0894PP_ch06 15/3/02 11:02 am Page 135selected from a normal distribution, whose mean was known to be each of the 10 samples, the mean and 90% confidence intervalswere calculated.
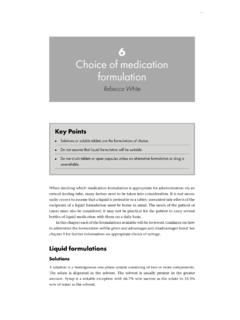
4 (The method for doing this is shown in the followingsection and does not need to be explained at this stage.) An example ofthe outcome for each sample is shown in Figure The central portionof the bar denotes the mean that has been calculated using the sampledata. The regions that extend equally beyond the mean in either direc-tion are the calculated 90% confidence intervals . As for any range, thereare upper and lower limits. The calculated mean and (90%) confidenceintervals for each sample may be plotted on the one graph, as shown inFigure The mean of the population has been included in this graphas a dashed features of Figure require clarification to enable thereader to fully understand the basis of confidence intervals .
5 First, it may be observed that, as expected, the means of all the differentsamples, although numerically close, are not equal to the population , the means of the individual samples are not numerically equal,once more reflecting sample variability. Secondly, the confidence intervals of the individual groups also differ in mag-nitude. These differences may also be logically explained. confidence inter-vals are calculated using the standard deviation of the sample and therefore, ifthe variability of a sample is large, then the size of the confidence interval ( range) will be larger. Consequently, differences in the sizes of the confi-dence intervals reflect differences in the standard deviations of the individualsamples.
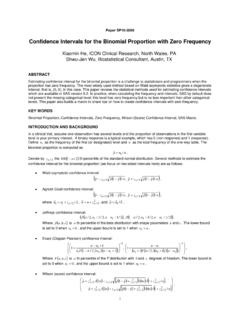
6 Finally, it may be observed from Figure that, although the individualsample means do not exactly equal the population mean, the 90% confidenceintervals in all but one case (denoted by an asterisk) do encompass the popula-tion mean. Therefore, the calculated 90% confidence intervals have includedthe population mean in 9 out of 10 observations, 90% of observations. If136 Statistical estimation using confidence intervalsFigure and confidence confidence interval range for theindividual sampleMean of sample (N = 10)LowerUpper0894PP_ch06 15/3/02 11:02 am Page 136the 95% confidence intervals had been calculated for each sample and plottedas described in Figure , the confidence intervals would have encompassedthe true mean in 19 out of 20 samples (95%), and so intervals are therefore calculated to provide the user withthe probability that a single sample will contain the true mean (or indeedtrue standard deviation, etc).
7 It is still possible that if a sample isremoved and the mean &95% confidence intervals calculated, the truemean will not fall within the range calculated. However, it is also truethat if another 19 samples were removed and the mean &95% confi-dence intervals calculated, the true mean would fall within the confi-dence intervals described by these 19 calculation of confidence intervals is performed with referenceto a probability distribution, the normal distribution, tdistributionor 2distribution. The mechanism for performing such calculationsforms the basis of the remainder of this confidence intervals for the population mean and thenormal distributionOne of the most frequently used methods for calculating confidenceintervals involves the use of the normal distribution.
8 If the data con-forms to the normal distribution, the two-tailed confidence interval maybe calculated using the following equation:P%=KX & z P% N confidence intervals for the population mean137 Figure and 90% confidence intervals derived from 10 samples (10observations per sample group).Mean confidence intervals = 50*Arbitrary units1008060402000894PP_ch06 15/3/02 11:02 am Page 137where P% is the selected confidence interval, usually 90%, 95% or99%, is the observed mean, is the population standard deviationand z P%is the zvalue corresponding to the percentage confidenceinterval. Remember that the term refers to the standard error ofthe mean, previously introduced in Chapter zvalue is therefore an important parameter in the calculationof confidence intervals .
9 confidence limits are two-tailed events as thereare two possible outcomes, one interval below and one intervalabove the mean. The zvalue chosen for inclusion in the equation or cal-culation of confidence is dependent on the selected value of the proba-bility, as shown in Figure Therefore, if we want to calculate the95% confidence interval, we choose a zvalue of as this value cor-responds to the area under the standard normal distribution that encom-passes 95% of all values. Similarly, and are chosen when 99%and 90% confidence intervals are to be calculated. The calculation ofconfidence intervals based on the standardised normal distribution isshown in the following clinical trial (N#30 patients) has been performed inwhich the volume of distribution of a new anti-diabetes drug has beencalculated as L.
10 Calculate the 95% and 99% confidencelimits of the mean value (assuming that the data originated from anormal distribution). 95% confidence interval. From the standardised normal distribution, the zstatistic associated with 95% probability (two-tailed) is Therefore the95% confidence interval is calculated as follows: 99% confidence interval. Similarly, the 99% confidence interval is calculatedusing a zvalue of (corresponding to 99% probability in a two-tailedoutcome):Having calculated these values, it is important at this point for thereader to fully comprehend the meaning of confidence intervals . In theclinical example described, the 95% confidence interval L, L.