Transcription of STATISTICAL RELEASE
1 Private Bag X44, Pretoria, 0001, south africa , ISIbalo House, Koch Street, Salvokop, Pretoria, 0002 , Tel +27 12 310 8911 STATISTICAL RELEASE national Poverty Lines 2021 Embargoed until: 9 September 2021 13:00 ENQUIRIES: FORTHCOMING ISSUE: EXPECTED RELEASE DATE Werner Ruch 2022 31 August 2022 012 406 3317 STATISTICS south africa 2 national Poverty Lines (2021) CONTENTS Key findings .. 3 Explanatory notes .. 6 1. Background .. 6 2. Purpose of the national poverty lines .. 6 3. Adjustments to the national poverty lines .. 7 4. Development of the national poverty lines .. 7 Construction of the food reference basket .. 8 The food poverty line .. 11 The lower and upper-bound poverty lines.
2 11 General information .. 13 List of tables Table 1: Inflation-adjusted national poverty lines for 2021 (per person per month in rands) .. 3 Table 2: Inflation-adjusted national poverty lines, 2006 to 2021 (per person per month in rands) .. 4 Table 3: The reference food basket based on the IES 2010/2011 .. 10 List of figures Figure 1: Inflation-adjusted national poverty lines, 2006 to 2021 (per person per month in rands) . 5 STATISTICS south africa 3 national Poverty Lines (2021) KEY FINDINGS Changes in the cost of living ( price changes for goods and services) require that we make regular adjustments to the national poverty lines (NPLs) to maintain their integrity and relevance over time. The most common change we make is to annually adjust the NPLs using the Consumer Price Index (CPI) series.
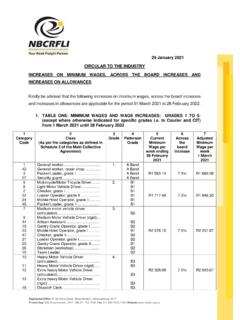
3 Table 1 below shows the results of these adjustments and provides the 2021 line values for the three national poverty lines (linked to April 2021 prices). Table 1: Inflation-adjusted national poverty lines for 2021 (per person per month in rands) Poverty line 2021 line values Food poverty line (FPL) 624 Lower-bound poverty line (LBPL) 890 Upper-bound poverty line (UBPL) 1 335 The national poverty lines were constructed using the cost-of-basic-needs approach which links welfare to the consumption of goods and services. The lines contain both food and non-food components of household consumption expenditure. Food poverty line R624 (in April 2021 prices) per person per month. This refers to the amount of money that an individual will need to afford the minimum required daily energy intake.
4 This is also commonly referred to as the extreme poverty line; Lower-bound poverty line R890 (in April 2021 prices) per person per month. This refers to the food poverty line plus the average amount derived from non-food items of households whose total expenditure is equal to the food poverty line; and Upper-bound poverty line R1 335 (in April 2021 prices) per person per month. This refers to the food poverty line plus the average amount derived from non-food items of households whose food expenditure is equal to the food poverty line. Table 2 and Figure 1 show the inflation-adjusted poverty line series for the period 2006 to 2021. These poverty line values are benchmarked to household expenditure data sourced from the Income and Expenditure Survey (IES) 2010/2011.
5 STATISTICS south africa 4 national Poverty Lines (2021) Table 2: Inflation-adjusted national poverty lines, 2006 to 2021 (per person per month in rands) Year* Food Poverty Line (FPL) Lower-bound Poverty Line (LBPL) Upper-bound Poverty Line (UBPL) 2006 219 370 575 2007 237 396 613 2008 274 447 682 2009 318 456 709 2010 320 466 733 2011 335 501 779 2012 366 541 834 2013 386 572 883 2014 417 613 942 2015 (April) 441 647 992 2016 (April) 498 714 1 077 2017 (April) 531 758 1 138 2018 (April) 547 785 1 183 2019 (April) 561 810 1 227 2020 (April) 585 840 1 268 2021 (April) 624 890 1 335 * Unless otherwise indicated, the values are linked to March prices of their respective years STATISTICS south africa 5 national Poverty Lines (2021) Figure 1: Inflation-adjusted national poverty lines, 2006 to 2021 (per person per month in rands) Risenga Maluleke Statistician-General 0200400600800100012001400160020062007200 8200920102011201220132014201520162017201 8201920202021 Food Poverty LineLower-bound Poverty Line (LBPL)Upper-bound Poverty Line (UBPL) STATISTICS south africa 6 national Poverty Lines (2021) EXPLANATORY NOTES 1.
6 Background Poverty lines are important tools that allow for the STATISTICAL reporting of poverty levels and patterns, as well as the planning, monitoring and evaluation of poverty reduction programmes and policies. In 2007, Stats SA was officially tasked by government to establish a threshold that could be used in standardising the money-metric measurement of poverty for the country. After extensive stakeholder consultations, expert engagements and several discussion documents on the appropriate approach for poverty measurement in south africa , Stats SA published the country's official national poverty lines in 2012. In developing the national poverty lines, Stats SA used an internationally recognised approach, namely the cost-of-basic-needs approach, which links welfare to the consumption of goods and services.
7 In 2015, Stats SA published rebased NPLs using updated household expenditure data sourced from the IES 2010/2011. 2. Purpose of the national poverty lines The primary purpose of the national poverty lines is to provide a tool for the STATISTICAL measurement of money-metric poverty. More specifically, the NPLs were developed to: a) Provide a consistent and constant benchmark against which progress on a money-metric/ expenditure-based dimension of poverty can be monitored; b) Improve the country s ability to target developmental policies and programmes, both towards specific groups and/or regions (through determining the poverty profile); and c) Increase knowledge production for policy development and reform around poverty reduction and eradication. It is important to note that the national poverty lines were not designed to be used for: Determination of equitable share to provinces Setting the national minimum wage Determining eligibility thresholds Determining the amount to be paid for social grants Nevertheless, the NPLs can help inform and serve as a possible input into some of these processes in ways that could create pro-poor dimensions.
8 STATISTICS south africa 7 national Poverty Lines (2021) 3. Adjustments to the national poverty lines Changes in the cost of goods and services, as well as changes in household consumption patterns are both key elements that need to be accounted for during maintenance of the NPLs. Both are expected to change over time, although in different ways and at different rates (for example, the cost of goods and services tends to change more rapidly and frequently compared to household consumption patterns). As time goes on, changes in the cost of living affect the purchasing power or value implied by the poverty lines. Therefore, to maintain the integrity of the NPLs, two types of updates are required, namely 1) adjustment by means of an inflation index and 2) construction of new poverty lines.
9 The construction of new poverty lines is generally done once every 5 to 10 years or when there are notable changes observed in household consumption patterns. The latest rebasing of the NPLs was done using IES 2010/2011 data to create the benchmark 2011 national poverty lines. Since this last rebasing, Stats SA has used the CPI series to make annual price adjustments to the benchmark 2011 NPLs to ensure they are reflective of current prices (Section 4 goes into further detail about the most recent rebasing). Because food and non-food prices do not always move in tandem with each other (that is, in the same direction and by the same magnitude), each component of the poverty line is adjusted separately. Meaning that the food portion of the NPLs is adjusted using the CPI for food items and the non-food portion of the NPLs (LBPL and UBPL) are adjusted using a CPI of non-food items.
10 As a result of the COVID-19 pandemic and subsequent national lockdown, there were some changes made to the collection methodology and compilation of the CPI which was used as an input for the inflation adjustments to the 2021 NPLs. These changes are documented in the CPI STATISTICAL RELEASE (P0141). 4. Development of the national poverty lines Following the RELEASE of the IES 2010/2011, Stats SA initiated a process to rebase the three national poverty lines (FPL, LBPL and UBPL) to bring them in line with the latest household expenditure data. The original set of poverty lines were benchmarked to information gathered from the IES 2000. The rebasing was completed in 2014 and the updated national poverty lines were published in 2015. The need for rebasing the national poverty lines emanates from the fact that spending and consumption patterns change over time.