Transcription of Statistics: 1.1 Paired t-tests - www.statstutor.ac.uk
1 Paired t-testsRosie Shier. IntroductionA Paired t-test is used to compare two population means where you have two samples inwhich observations in one sample can be Paired with observations in the other of where this might occur are: Before-and-after observations on the same subjects ( students diagnostic testresults before and after a particular module or course). A comparison of two different methods of measurement or two different treatmentswhere the measurements/treatments are applied to the same subjects ( bloodpressure measurements using a stethoscope and a dynamap).2 Procedure for carrying out a Paired t-testSuppose a sample ofnstudents were given a diagnostic test before studying a particularmodule and then again after completing the module. We want to find out if, in general,our teaching leads to improvements in students knowledge/skills ( test scores). Wecan use the results from our sample of students to draw conclusions about the impact ofthis module in test score before the module,y= test score after the moduleTo test the null hypothesis that the true mean difference is zero, the procedure is asfollows:1.
2 Calculate the difference (di=yi xi) between the two observations on each pair,making sure you distinguish between positive and negative Calculate the mean difference, Calculate the standard deviation of the differences,sd, and use this to calculate thestandard error of the mean difference,SE( d) =sd n4. Calculate the t-statistic, which is given byT= dSE( d). Under the null hypothesis,this statistic follows a t-distribution withn 1 degrees of Use tables of the t-distribution to compare your value for T to thetn will give the p-value for the Paired :For this test to be valid the differences only need to be approximatelynormally , it would not be advisable to use a Paired t-test where there were any the above example withn= 20 students, the following results were obtained:StudentPre-modulePost-moduleDif ferencescorescore11822+422125+431617+142 224+251916-362429+571720+382123+292319-4 101820+2111415+1121615-1131618+2141926+7 1518180162024+4171218+6182225+3191519+42 01716-1 Calculating the mean and standard deviation of the differences gives: d= andsd= Therefore,SE( d) =sd n= 20= , we have.
3 T= on 19 dfLooking this up in tables givesp= Therefore, there is strong evidence that, onaverage, the module does lead to Confidence interval for the true mean differenceThe in above example the estimated average improvement is just over 2 points. Note thatalthough this is statistically significant, it is actually quite a small increase. It would beuseful to calculate a confidence interval for the mean difference to tell us within what limitsthe true difference is likely to lie. A 95% confidence interval for the true mean difference is: d t sd nor, equivalently d (t SE( d))wheret is the point of the t-distribution onn 1 degrees of our example:We have a mean difference of The point of the t-distribution with 19 degreesof freedom is The 95% confidence interval for the true mean difference is ( ) = = ( , )This confirms that, although the difference in scores is statistically significant, it is actuallyrelatively small.
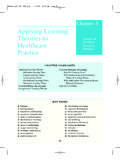
4 We can be 95% sure that the true mean increase lies somewhere betweenjust under one point and just over 3 Carrying out a Paired t-test in SPSSThe simplest way to carry out a Paired t-test in SPSS is to compute the differences (usingTransform,Compute) and then carrying out a one-sample t-test as follows: Analyze Compare Means One-Sample T Test Choose the difference variable as theTest Variableand clickOKThe output will look like this:One-Sample StatisticsNMeanStd. DeviationStd. Error TestTest Value = 095% Confidence IntervaltdfSig. (2-tailed)Mean