Transcription of Statistics report for the Logistics industry (road haulage ...
1 Logistics , 2013/14p Page 1 Statistics report for the Logistics industry (road haulage and warehousing), 2009/10 to 2013/14p ( provisional ) Introduction This report examines the accidents reported in the Logistics industry over a five year period from 2009/10 to 2013/14p. The data represents accidents and dangerous occurrences reported to HSE under the Reporting of Injuries, Diseases and Dangerous Occurrences Regulations (RIDDOR) 1995. A further section covers enforcement activity carried out by HSE in the four years to 2013/14p. In 2009, HSE transferred to a new Standard Industrial Classification system (SIC 2007 from SIC 2003).
2 industry data for years before 2010/11 has been subject to automatic back coding from SIC 2003 to SIC 2007, so injury numbers for 2009/10 and earlier must be considered to be estimates. The following industries are in scope: SIC 49 Land transport and transport via pipelines SIC 50 Water transport SIC 52 Warehousing and support activities for transportation SIC 53 Postal and courier activities Rail transport injuries are not included. Recent changes to the RIDDOR reporting systems and to the definitions of reportable injuries have resulted in coding discontinuities. 1 As a result, it is no longer possible to produce robust injury Statistics at a more detailed level than the 2 digit SIC classifications listed above, nor to identify clear trends at 2 digit level.
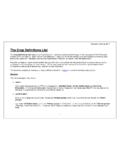
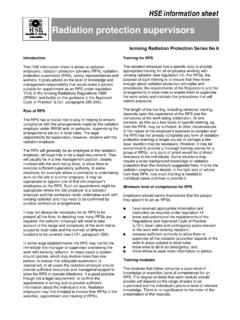
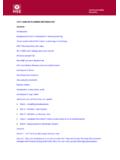
3 (Figure 1 shows that the coding of Logistics injuries has shifted from predominantly land transport to predominantly warehousing.) 1 See for an estimate of the effect of the 2012/13 over 3 to over 7 day change on lost time injury numbers. Logistics , 2013/14p Page 2 Figure 1 Injuries in Logistics , 2009/10 to 2013/14p Table 1 Injuries in Logistics (combined SICs, ,52 & 53), 2009/10 to 2013/14p Fatal Employee Year Self-employed Employee Major/ specified Over 3/ over 7 day Total 2009/10 - 10 2 694 14 390 17 094 2010/11 - 12 2 473 12 371 14 856 2011/12 1 7 2 114 11 407 13 528 2012/13 - 6 1 986 7 565 9 557 2013/14p 1 9 1 905 7 109 9 023 Total 2 44 11 172 52 842 64 058 Member of the public Fatal 2009/10 2 2010/11 1 2011/12 3 2012/13 1 2013/14p - Total 7 0200040006000800010000120001400016000180 002009/102010/112011/122012/132013/14p50 Water transport53 Postal & courier52 Warehousing & support for transport49 Land transport (& via pipelines)
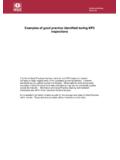
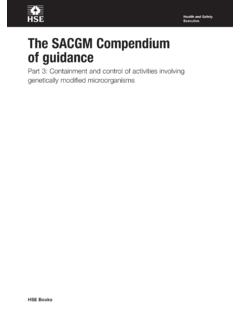
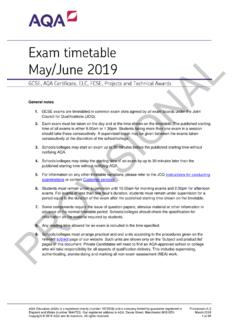
4 Logistics , 2013/14p Page 3 Figure 2 Share of total injuries to employees in Logistics , by industry , 2009/10 2013/14p combined (RIDDOR) 50 Water transport 1% 53 Postal & courier 26% 52 Warehousing & support for transport 35% 49 Land transport (& via pipelines) 38% Logistics , 2013/14p Page 4 Table 2 Injuries and rates of injury to employees in land transport and warehousing (SICs 49 & 52 combined, RIDDOR) 2009/10 2010/11 2011/12 2012/13 2013/14p Total Injuries Fatal 10 12 6 5 8 41 Major/specified 2 030 1 884 1 550 1 484 1 471 8 419 Over 3/over 7 day 9 676 8 587 8 254 5 795 5 680 37 992 Total 11 716 10 483 9 810 7 284 7 159 46 452 Rate per 100 000 employees Fatal Major/specified Over 3/over 7 day Total Table 3 Injuries to employees in postal and courier activities (SIC53, RIDDOR)
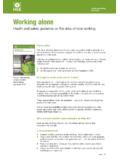
5 2009/10 2010/11 2011/12 2012/13 2013/14p Total Injuries Fatal - - 1 1 - 2 Major/specified 632 555 518 463 387 2 555 Over 3/over 7 day 4 596 3 660 2 944 1 628 1 278 14 106 Total 5 228 4 215 3 463 2 092 1 665 16 663 Rate per 100 000 employees Fatal -- -- - Major/specified Over 3/over 7 day Total Logistics , 2013/14p Page 5 Kind of accidents 2009/10 to 2013/14p Over the period from 2009/10 to 2013/14p, the most common cause of a fatal injury to Logistics employees was being struck by a moving vehicle. (In 2013/14p, for all industries, vehicle injuries were the third most common cause, with falls from height the most ) 41 out of 44 fatal injuries were in land transport & warehousing.
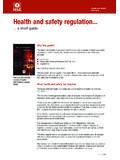
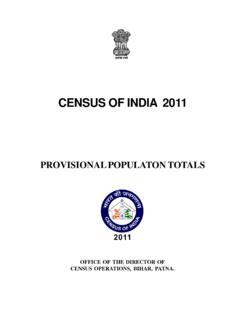
6 Figure 3 Fatal injuries to employees in Logistics by kind, 2009/10 to 2013/14p combined The main kind of major/specified injury was a slip or trip. (This is the most common kind of major injury across all industries.) Slips and trips accounted for about two thirds of major/specified injuries in the other Logistics (postal and courier and water transport) industries but only just over a third of injuries in transport and warehousing. Falls from height, handling injuries and being struck by a falling object accounted for a much higher proportion of major/specified injuries in transport & warehousing. Slips and trips were also the top cause of over-3-day and over-7-day injuries in other Logistics , accounting for about four in ten injuries.
7 Handling injuries were the top cause of over-3-day and over-7-day injuries in transport and warehousing, also accounted for about four in ten reports. 3% of major injuries in and 5% of lost time injuries on other Logistics were due to being injured by an animal. Numbers of this kind of injury were very low in transport & warehousing. 2 See Vehicle, 16 Struck by moving object, 11 Fall from height, 8 Trapped by something collapsing, 3 Other & unspecified kinds, 6 Logistics , 2013/14p Page 6 Table 4 Kinds of non-fatal injuries to employees in Logistics , 2009/10 to 2013/14p Post & water transport Transport & wh/sing Total Post & water transport Transport & wh/sing Total Major / specified Slip, trip.
8 Fall same level 1 750 2 907 4 657 64% 35% 42% Fall from height 316 1 850 2 166 11% 22% 19% Lifting and handling injuries 182 1 039 1 221 7% 12% 11% Struck by object 177 985 1 162 6% 12% 10% Struck by moving vehicle 48 525 573 2% 6% 5% Injured by an animal 77 15 92 3% 0% 1% Unspecified and all other kinds <5% 203 1 098 1 301 7% 13% 12% Total 2 753 8 419 11 172 100% 100% 100% Over-3 -day/ over-7-day Lifting and handling injuries 4 268 14 539 18 807 29% 38% 36% Slip, trip, fall same level 6 086 8 462 14 548 41% 22% 28% Struck by object 1 173 4 245 5 418 8% 11% 10% Fall from height 906 2 563 3 469 6% 7% 7% Struck against 538 2 082 2 620 4% 5% 5% Injured by an animal 766 53 819 5% 0% 2% Unspecified and all other kinds <5% 1 113 6 048 7 161 7% 16% 14% Total 14 850 37 992 52 842 100% 100% 100% Logistics , 2013/14p Page 7 Dangerous Occurrences Table 5 - Dangerous Occurrence Kind3 2011/2012 2012/2013 2013/14p Total SIC 49 Land transport and transport via pipelines Collapse, overturning.
9 Failure of lifting equipment - 3 7 10 Escape of flammable substances - sudden uncontrolled release 3 4 5 12 Accidental release or escape of substances liable to cause harm - 5 5 10 Carriage of dangerous goods by road - release, escape of substances 3 2 1 6 All other Dangerous Occurrence kinds 8 10 13 31 Total 14 24 31 69 SIC 50 Water transport Collapse, overturning, failure of lifting equipment 7 11 8 26 All other Dangerous Occurrence kinds 11 2 3 16 Total 18 13 11 42 SIC 52 Warehousing and support activities for transportation Collapse, overturning, failure of lifting equipment 51 71 85 207 Accidental release or escape of substances liable to cause harm 12 19 14 45 Unintended collapse, partial collapse of building or structure 9 5 9 23 Fire and explosions caused by electrical short circuit 5 11 4 20 Explosion or fire resulting in plant stoppage 4 4 8 16 Freight container failure 2 7 5 14 Escape of flammable substances - sudden uncontrolled release 3 5 5 13 All other Dangerous Occurrence kinds 10 26 15 51 Total 96 148 145 389 SIC 53 Postal and courier activities Accidental release or escape of substances liable to cause harm 2 3 2 7 Collapse, overturning.
10 Failure of lifting equipment 1 1 2 4 All other Dangerous Occurrence kinds 2 6 5 13 Total 5 10 9 24 3 Dangerous Occurrence definitions changed midway through 2013/14. Where a match is possible (eg lifting machinery collapse) dangerous occurrences have been assigned the same code. Logistics , 2013/14p Page 8 Enforcement Notices and Prosecutions. Table 6 Enforcement notices issued by HSE in Logistics industries, 2010/11 to 2013/14p Prohibition (immediate & deferred) Improvement Total SIC 49 Land transport and transport via pipelines 2010/2011 17 49 66 2011/2012 15 48 63 2012/2013 12 55 67 2013/14p 18 76 94 SIC 50 Water transport 2010/2011 1 2 3 2011/2012 1 2 3 2012/2013 - 8 8 2013/14p 4 8 12 SIC 52 Warehousing and support activities for transportation 2010/2011 10 31 41 2011/2012 13 49 62 2012/2013 9 47 56 2013/14p 8 25 33 SIC 53 Postal and courier activities 2010/2011 - 4 4 2011/2012 - 6 6 2012/2013 - 3 3 2013/14p - 4 4 Table 7 Prosecutions instituted by HSE in Logistics industries.