Transcription of Status of Groundwater Levels and Storage Volume …
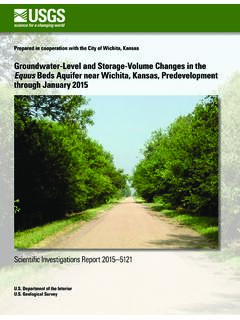
1 West Emma CreekDry CreekMiddle Emma CreekEast Emma CreekMud CreekSand CreekJester CreekBlack Kettle CreekLittle Arkansas RiverLittle Arkansas RiverLittle ArkansasRiverKisiwa CreekBurrtonHalsteadValleyCenterMountHop eNewtonSEDGWICK COUNTYRENO COUNTY50K96135 SedgwickBentleyArkansas River Arkansas RiverHARVEY COUNTYSEDGWICK COUNTY-20-202020-15-15-10-101515-5-51010 5500-5-5-5-500000000-10-10-5-5-5-5000000 Prepared in cooperation with the City of Wichita, KansasStatus of Groundwater Levels and Storage Volume in the equus Beds Aquifer near Wichita, Kansas, 2012 to 2014 Scientific Investigations Report 2014 Department of the Geological SurveyFront cover. Figure 18 of this of Groundwater Levels and Storage Volume in the equus Beds Aquifer near Wichita, Kansas, 2012 to 2014By Cristi V. Hansen, Joshua A. Whisnant, and Jennifer L. Lanning-RushPrepared in cooperation with the City of Wichita, KansasScientific Investigations Report 2014 Department of the Geological Department of the InteriorSALLY JEWELL, Geological SurveySuzette M.
2 Kimball, Acting Geological Survey, Reston, Virginia: 2014 For more information on the USGS the Federal source for science about the Earth, its natural and living resources, natural hazards, and the environment, visit or call 1 888 ASK an overview of USGS information products, including maps, imagery, and publications, visit order this and other USGS information products, visit use of trade, firm, or product names is for descriptive purposes only and does not imply endorsement by the this information product, for the most part, is in the public domain, it also may contain copyrighted materials as noted in the text. Permission to reproduce copyrighted items must be secured from the copyright citation:Hansen, , Whisnant, , and Lanning-Rush, , 2014, Status of Groundwater Levels and Storage Volume in the equus Beds aquifer near Wichita, Kansas, 2012 to 2014: Geological Survey Scientific Investigations Report 2014 5185, 39 p.
3 , 2328-0328 (online)iiiAcknowledgmentsThe authors acknowledge the assistance of Michael Jacobs, Debra Ary, Rich Robinson, and staff of the city of Wichita; and Tim Boese, Steve Flaherty, and staff of equus Beds Groundwater Management District Number 2 for providing water-level data and for their technical reviews, which contributed to improved technical and editorial clarity of the reviews by Geological Survey employees Brian Kelly and Geoff Delin also contrib-uted to improved technical and editorial clarity of the report. ivContentsAcknowledgments ..iiiAbstract .. and Scope ..2 Description of Study Area ..2 Hydrogeology of the Study Area ..4 Previous Studies .. and Deep Parts of the equus Beds Aquifer ..7 Water Levels ..7 Water-Level Measurements ..7 Data Quality and Limitations ..8 Water-Level Altitudes ..8 Water-Level Change ..10 Specific Yield ..10 Total Aquifer Storage Volume .
4 10 Aquifer Storage - Volume Change ..11 Water-level Altitude Maps ..11 Winter 2012 ..12 Winter 2013 ..12 Winter 2014 ..12 Summer and Storage - Volume Changes in the equus Beds Aquifer ..19 Predevelopment to Winter 2014 ..25 Predevelopment to Summer 2012 ..291993 to Winter 2014 ..291993 to Summer 2012 .. 1. Map showing location of study area near Wichita, south-central Kansas ..3 2. Graphs showing relation of precipitation and water use for the city of Wichita public supply and agricultural irrigation in the study area, 1938 through 2013 ..5 3. Graph showing statistical relation between annual Groundwater irrigation use and average annual precipitation in the study area, 1988 through 2012 ..6v 4. Map showing static water-level altitudes in the shallow part of the equus Beds aquifer, winter 2012 ..13 5. Map showing static water-level altitudes in the deep part of the equus Beds aquifer, winter 2012.
5 14 6. Map showing static water-level altitudes in the shallow part of the equus Beds aquifer, winter 2013 ..15 7. Map showing static water-level altitudes in the deep part of the equus Beds aquifer, winter 2013 ..16 8. Map showing static water-level altitudes in the shallow part of the equus Beds aquifer, winter 2014 ..17 9. Map showing static water-level altitudes in the deep part of the equus Beds aquifer, winter 2014 ..18 10. Map showing water-level altitudes in the shallow part of the equus Beds aquifer, summer 2012 ..20 11. Map showing water-level altitudes in the deep part of the equus Beds aquifer, summer 2012 ..21 12. Graph showing average measured water-level changes in the equus Beds aquifer in the shallow part of the aquifer since predevelopment and in the shallow and deep parts of the aquifer since 1993 ..24 13. Graph showing Storage - Volume changes since predevelopment and since 1993 in the study area, the basin Storage area, and the central part of the study area.
6 26 14. Map showing static water-level changes in the shallow part of the equus Beds aquifer, predevelopment to winter 2014 ..27 15. Graph showing annual Groundwater use in the central part of the study area and in the rest of the study area and average annual precipitation in the study area, 1988 through 2012 ..28 16. Map showing water-level changes in the shallow part of the equus Beds aquifer, predevelopment to summer 2012 ..30 17. Map showing static water-level changes in the shallow part of the equus Beds aquifer, 1993 to winter 2014 ..31 18. Map showing water-level changes in the shallow part of the equus Beds aquifer, 1993 to summer 2012 ..33 19. Map showing water-level changes in the deep part of the equus Beds aquifer 1993 to summer 2012 ..34 Tables 1. Streamgages and low-head dams in and near the study area, south-central Kansas ..9 2. Precipitation stations in and near the study area, south-central Kansas.
7 11 3. Average water-level changes, Storage - Volume changes, and total aquifer Storage Volume in the equus Beds aquifer near Wichita, south-central Kansas, predevelopment to winter 2014 ..22 1 1. Measured and interpolated water-level altitudes in the equus Beds aquifer, predevelopment, 1993, winter 2012, summer 2012, winter 2013, and winter 2014 ..39viConversion FactorsInch/Pound to SIMultiplyByTo obtainLengthinch (in.) (cm)foot (ft) (m)mile (mi) (km)Areaacre4,047square meter (m2) (ha) kilometer (km2)square mile (mi2) (ha)square mile (mi2) kilometer (km2) Volumeacre-foot (acre-ft)1,233cubic meter (m3)acre-foot (acre-ft) gallons (Mgal)Flow ratecubic foot per second (ft3/s) meter per second (m3/s)million gallons per day (Mgal/d) meter per second (m3/s)Temperature in degrees Fahrenheit ( F) may be converted to degrees Celsius ( C) as follows: C=( F-32) coordinate information is referenced to the North American Vertical Datum of 1988 (NAVD 88)Horizontal coordinate information is referenced to the North American Datum of 1983 (NAD 83)Altitude, as used in this report, refers to distance above the vertical of Groundwater Levels and Storage Volume in the equus Beds Aquifer near Wichita, Kansas, 2012 to 2014By Cristi V.
8 Hansen, Joshua A. Whisnant, and Jennifer L. Lanning-Rush AbstractDevelopment of the Wichita well field in the equus Beds aquifer in southwest Harvey County and northwest Sedgwick County began in the 1940s to supply water to the city of Wichita. The decline of water Levels in the equus Beds aquifer was noted soon after the development of the Wichita well field began. Development of irrigation wells began in the 1960s. City and agricultural withdrawals led to substantial water-level declines. Water-level declines likely enhanced movement of brines from past oil and gas activities near Burrton, Kansas, as well as natural saline water from the Arkansas River into the Wichita well field area. Large chloride concentrations may limit use, or require the treatment of water from the well field for irrigation or public supply. In 1993, the city of Wichita adopted the Integrated Local Water Supply Program to ensure an adequate water supply for the city through 2050 and man-age effectively the part of the equus Beds aquifer Wichita uses.
9 The Integrated Local Water Supply Program uses several strategies to do this, including the equus Beds Aquifer Storage and Recovery project. The purpose of the Aquifer Storage and Recovery project is to store water in the aquifer for later recovery, and help protect the aquifer from encroachment of a known oil-field-brine plume near Burrton and saline water from the Arkansas River. Since 1940, the Geological Survey, in cooperation with the city of Wichita, has monitored changes in the equus Beds aquifer as part of Wichita s effort to manage this resource water-level changes since predevelopment (before substantial pumpage began in the area) for winter 2012, summer 2012, winter 2013, and winter 2014 generally indicate greater declines in the central part of the study area than in either the basin Storage or entire study area. In contrast, average water-level rises since 1993 for winter 2012, sum-mer 2012, winter 2013, and winter 2014 were greater for the central part of the study area than for either the basin Storage area or entire study area.
10 This indicates the central part of the study area had more post-1993 water-level recovery than did the rest of the study area. In the central part of the study area, city water use decreased by about 40 percent, and irrigation water use increased by about 3 percent compared to pre-1993 peaks in 1992 and 1991, respectively, whereas irrigation water use outside the central part of the study area increased by about 24 percent from the pre-1993 peak in 1991. Part of the larger increase in irrigation pumpage probably was a result of drought-term and multiyear flex account permits, which were estimated to account for about 8 and 4 percent of irrigation pumpage in the study area in 2011 and was a larger percentage Storage - Volume increase since 1993 in the central part of the study area than in either the basin Storage area or the entire study area. Storage - Volume in the central part of the study area during winter 2012, sum-mer 2013, winter 2013, and winter 2014 recovered about 46,300 acre-feet or more compared to the Storage Volume in 1993.
