Transcription of STATUS TY - San Antonio
1 1 STATUS OF POVERTYIn San Antonio2 Executive SummarySan Antonio is a growing and vibrant city - in 2018 it was named one of the 15 best cities in the country to live in. Recent reports, such as Insights, Aspirations and Action Investing in Asset Building for San Antonio Families (commissioned by Asset Funders Network), STATUS of Women on poverty (commissioned by the Mayor s Commission on the STATUS of Women), American Community Survey data, Urban Institute data and presentations completed by Dr. Christine Drennon and others, point to the fact that San Antonio is also marked by high economic inequality, racial disparities, and residential segregation. People living north and northwest of downtown generally have more economic prosperity, higher education, and better health outcomes, while those living in central San Antonio and areas immediately east, west and south of the city center experience higher poverty , lower educational attainment, and higher rates of morbidity and disease.
2 Economic segregation in San Antonio is deeply entwined with racial segregation, much of which can be traced to historical policies and practices that resulted in an urban core of concentrated poverty and socioeconomic disadvantage. While these practices have faded, they created a profound and ongoing effect on the racial/ethnic and regional disparities in poverty that are still evident in San Antonio brief report, developed by the City of San Antonio s Human Services Department and Metropolitan Health District, builds on previous reports and community conversations and provides recommended strategies to focus investments on evidence-based poverty alleviation initiatives. Information included in this report is structured around nine major frameworks: Employment and Income, Education and Skills Development, Wealth and Assets, Business Entrepreneurship, Affordable Housing, Homelessness, Physical and Mental Health, and Access to Transportation. The following information provides data to describe the landscape of poverty in San Antonio and Bexar County, summarizes major City of San Antonio investments, and provides a set of policy recommendations to consider for Landscape In September 2019, the Census Bureau released the latest wave of American Community Survey 1-year Estimate data, providing state- and local-level 2018 estimates of factors such as poverty , income, and education.
3 According to the report, among the 25 most populous US Metropolitan Areas, the San Antonio -New Braunfels Metropolitan Area ranks highest for poverty . Since 2013, the overall poverty rate for the City of San Antonio has remained at 18-20%, indicating that about one in five individuals are experiencing the financial and social burdens of poverty . poverty is one of the most important determinants of health, longevity, and quality of City of San Antonio Investments In Fiscal Year 2020, the City invested roughly $ million in Local, State and Federal resources to mitigate barriers and challenges to social and economic mobility in San Antonio . The bulk of that funding supports education and skills development programs ($149 M) followed by Transportation ($128 M), Employment ($ M), Homelessness ($ M), Housing ($ M), Health ( M), Asset Building/Financial Empowerment ($ M), Business/ Entrepreneurship ($ M), and Income Stability ($ M) programs.
4 Recommendations In San Antonio , where you live matters and has a profound impact on your health, educational attainment, employment and quality of life. The City of San Antonio serves as a community leader in challenging the institutions and processes that perpetuate poverty and inequality across our community. In the Summer of 2019, the Asset Funders Network released a report titled Insights, Aspirations and Action Investing in Asset Building for San Antonio Families. This report includes key policy recommendations for consideration by elected officials, local funders, non-profit partners, and the public and private sectors. This report provides an analysis of these recommendations, including those that have partially or fully been implemented by the City of San Antonio , with additional recommendations for consideration to adopt. 3 Key Data FindingsOverview of poverty in San Antonio In 2018, of residents in San Antonio lived in poverty , compared to in Texas overall and in the US overall, with Hispanics and African Americans disproportionately affected.
5 Of children under 18 live in poverty compared to in Texas and in the of seniors over 65 live in poverty compared to in Texas and the in the A higher percentage of San Antonio women live in poverty when compared to Texas and the , Income, and Economic Mobility A larger proportion of those living in poverty in San Antonio are employed, compared with Texas and the overall. For those with Bachelor s degree or higher in San Antonio , the median hourly wage among African Americans and Hispanics is $23 compared to $29 in Non-Hispanic Whites. The percentage of Hispanics living on an income of less than $25,000 is close to double the percentage of non-Hispanic White residents. Educational Attainment and Skills Development 18% of San Antonio residents do not have a high school diploma, compared to in Texas and nationally. In San Antonio , non-high school graduates are times more likely to live in poverty than those with a high school degree or higher educational attainment.
6 Those in central and south San Antonio zip codes have a higher percent of residents with only a high school degree as compared to northwest zip , Assets, and Financial Health San Antonio families have lower median credit scores, higher delinquent debts, and limited savings compared to the national average. Medical debt in Bexar County surpasses that of Texas and the USA overall with non-White residents disproportionately affected with 35% having medical debt in collection compared to 18% of residents in predominately White zip Housing 55% of San Antonio households living in poverty are headed by a single female. Among San Antonio residents with income <$20,000, 91% of those who rent are housing cost-burdened, as opposed to 71% of those who own their to Transportation Close to 17% of African American households in San Antonio lack access to a car, compared to only 6% of White In San Antonio , there was a 6% reduction in overall homelessness, however there was a 18% increase in the number of families experiencing Ownership/Entrepreneurship In the San Antonio -New Braunfels MSA only 22% of firms were female-owned.
7 When looking at San Antonio New Braunfels MSA firm ownership by race, 87% are White-owned, 8% Asian owned, and 1% African American owned. Firms with at least partial ownership by Hispanics accounted for 28% of firms, while the other 72% were owned by and Mental Health 1 in 5 Bexar County children experience food insecurity. A higher percentage of San Antonio residents rely on cash public assistance or food stamps, compared with Texas or the overall. Bexar County had the 4th highest prevalence of both adults with serious mental illness and children with serious emotional conditions among all Texas counties in of ContentsAn overview of povertyAffordable HousingPhysical and Mental HealthAccess to Transportation Recommendations for Policy Considerations HomelessnessEmployment and IncomeEducational Attainment & Skill DevelopmentWealth, Assets, and Financial Health Small Business/EntrepreneurshipData and Key DefinitionsHousing Ownership DataFood InsecurityCar Access and Public Transportation Use Recommended StrategiesHomelessness Point in Time Count DataEmployment STATUS and Work Experience DataEducational Attainment DataFamily Wealth, Credit.
8 And Debt DataSmall Business Ownership/Entrepreneurship DataSan Antonio and Bexar County poverty DataHousing Cost BurdenSocioeconomic Disparities in Physical and Mental HealthWages and Earnings DataPoverty & EducationCity of San Antonio - Annual InvestmentsDisparities in PovertyHousing PriceHousehold Income DataCity of San Antonio - Annual InvestmentsCity of San Antonio - Annual InvestmentsCity of San Antonio - Annual InvestmentsHomelessness Point in TimeSub-Population CountsCity of San Antonio - Annual InvestmentsCity of San Antonio - Annual InvestmentsCity of San Antonio - Annual InvestmentsCity of San Antonio - Annual Investments16891072345517212426198121516 61721178131169141516192018232551. An Overview of PovertyThe United States determines the official poverty rate using poverty thresholds issued each year by the Census Bureau. poverty thresholds vary by the size of the family and age of its members, but not geographically. A family is counted as poor if its pretax money income is below its poverty threshold.
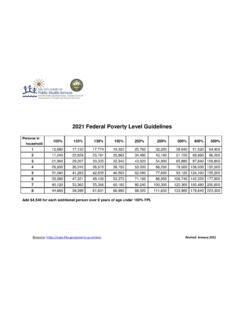
9 Cash benefits such as public housing, Medicaid, employer-provided health insurance, and food stamps are not included as thresholds are published and updated annually, with the latest data available for 2018 (Fig 1). These poverty estimates are based on three times the minimum food diet for individuals and do not take into account geographic variation in cost of living. Additionally, the below poverty figures do not take into account that those individuals living at 100% of the poverty threshold do not have a sufficient living , poverty guidelines are issued by the Department of Health and Human Services. poverty thresholds take the number and age of a family into account, while poverty guidelines take only the number of people in a family into account. poverty guidelines (often referred to as the federal poverty line or FPL ) are used to decide whether an individual or family qualifies for certain federal benefits and programs. For example, an income of less than 138% of the FPL will qualify an individual for Medicaid or the Children s Health Insurance Program (CHIP).
10 The 2017 FPL for a 1-person household was $12,060. This means that a single individual living in a one-person household will need to earn below x $12,060 = $16, to be eligible for that poverty is defined by tailored and time-varying thresholds , the technical poverty STATUS of individualscan change over time. Episodic poverty is defined as being in poverty for at least two consecutive months in athree-year period, while chronic poverty is defined as being in poverty every month over the course of threeyears. While episodic poverty is generally more prevalent than chronic poverty , the stress, setbacks, andchallenges resulting from both types of poverty can have lasting to chronic poverty is intergenerational poverty : poverty that is perpetuated across generations offamilies instead of being triggered by a specific situation. Such poverty is associated with prolonged exposure toconcentrated poverty and inadequate access to critical resources starting in childhood, such as poor nutrition, making it very difficult for children to escape poverty when they become adults.