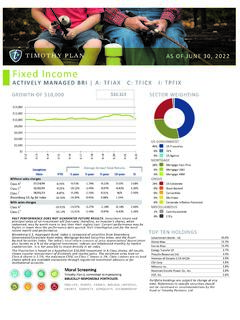
Transcription of Steel Demand Beyond 2030 - OECD
1 Steel Demand Beyond 2030. Forecast Scenarios Presented to: OECD. Paris September 28, 2017. Introduction Introduction The long range forecast model was developed to assess the potential impact of key forecast drivers and disruption forces on global Steel Demand to 2035. Forecast Drivers 88 Countries / 6 Groups Per capita GDP Mature: high manufacturing intensity Fixed Asset Investment intensity Mature: low manufacturing intensity Applied Emerging: high manufacturing intensity Baseline Manufacturing intensity to Emerging: low manufacturing intensity Projection Urbanization rate China Population growth rate India Disruption Forces Scenarios (tested incremental and radical disruption). Steel production and raw Application of digital technologies by customers, suppliers, other material producers material Circular economy and changing consumer preferences Tested for impact of increase in Reduced end product Demand EAF production share in China Longer end-product life including re-use and re-manufacturing and ROW.
2 Accelerated reduction in Steel intensity due to material and process substitution Copyright 2017 Accenture All rights reserved. 3. Forecast Drivers on Steel Demand As countries develop, their Steel consumption per capita increases to a peak point then per capita consumption starts declining -- finally plateauing For a given level of economic development -- the higher the importance of manufacturing, investment Steel Consumption per capita in fixed assets and urbanization, the higher the consumption of Steel 1. Economic Development Level High 2. Importance of Manufacturing Manufacturing/. FAI/Urbanization Sector 3. Fixed Asset Investments Low Manufacturing/. FAI/Urbanization 4. Urbanization 5. Steel De-Intensification Factors Economic Development Copyright 2017 Accenture All rights reserved.
3 (GDP per capita) 4. Shifting Peak Consumption of Steel per Capita Technology advancements have driven Steel consumption per capita in countries to peak at lower levels of GPD per capita and disruption factors may drive the peaks to even lower levels 1. Economic Development Level Steel Consumption per capita 2. Importance of Manufacturing Sector Historical economic 3. Fixed Asset Investments development 4. Urbanization Trend of Global 5. Steel De-Intensification Factors*. Steel De- Intensification Disruption * Factors include material substitutions, quality improvement of materials and changing design Economic Development (GDP per capita). Copyright 2017 Accenture All rights reserved. 5. Historical Analysis Testing the Model Predicting the Trend The econometric model that was developed indicates a very good fit at the global level Global Steel Demand : Actual vs In-sample Forecast vs Fitted Model 1,800,000.
4 1,600,000. 1,400,000. The Macro Layer - In- Steel Use (millions of tons). 1,200,000 sample Forecast (2010-2014) & Fitted 1,000,000. Values 1988-2014. 800,000 The model has an R2. 600,000 of at the global level 400,000. 200,000. 0. 1988. 1989. 1990. 1991. 1992. 1993. 1994. 1995. 1996. 1997. 1998. 1999. 2000. 2001. 2002. 2003 . 2004. 2005. 2006. 2007. 2008. 2009. 2010. 2011. 2012. 2013. 2014. Actual In-sample forecast Fitted Copyright 2017 Accenture All rights reserved. 7. Testing the Model Predicting the Peak The closer to the 45 degree line the better the model explains the peak per capita Identified Peak in Steel per Capita Chart shows data only for those countries that peaked in 2015 or earlier (N = 38). Model Predicted Steel per Capita at Peak (log scale). Copyright 2017 Accenture All rights reserved.
5 8. Historical Trend of Peak Per Capita Steel Over time countries have tended to reach peak Steel intensity at lower levels Copyright 2017 Accenture All rights reserved. 9. Disruption Forces Disruption Factors and Consumption Sectors The impact of disruption factors were estimated and applied to six major consumption sectors Disruption Factors Consumption Sectors Reduction in Demand for sector's product 1. Automotive Increase in useful life 2. Capital Equipment and Machinery Change in Steel intensity 3. Residential Construction 4. Commercial Construction 5. Consumer & Durable Goods 6. Infrastructure Copyright 2017 Accenture All rights reserved. 11. Detail - Automotive Using automotive as an example specific disruption factors were estimated and applied to the baseline estimate of Steel Demand Sector's Baseline Steel Auto Specific Disruption Factors Demand +/- Reduction In Sharing, transportation-as-service and consumer preference will decrease per Demand for capita passenger vehicle intensity (fewer vehicles per capita).
6 Sector's Product +/- Increase In Longer-lasting / reusable vehicle structural and exterior components as a result of Useful Life better design and materials will reduce annual Demand for new vehicles +/- Change in Steel Continued vehicle light weighting for both Steel (same surface area less mass). Intensity and impact of substitutes Copyright 2017 Accenture All rights reserved. 12. Total vehicle intensity - pre-disruption forecasts Vehicles per capita were estimated based on historical ratios and projections of economic development y = (x) - Note: Based on 120 countries. R2 = Note: Use growth rates form fitted model to project forecasts from actual historical data. Source: Accenture Research, Oxford Economics, OICA, 2016 Source: Accenture Research, Oxford Economics, OICA, 2016.
7 Copyright 2017 Accenture All rights reserved. 13. Total vehicle intensity - post-disruption forecasts (incremental scenario). The impact of the disruption factors shifted the estimated vehicle intensity estimates Solid line is baseline vehicle intensity dotted line represents vehicle intensity after disruptors Note: Use growth rates form fitted model to project forecasts from actual historical data. Copyright 2017 Accenture All rights reserved. Source: Accenture Research, Oxford Economics, OICA, 2016 14. Global Steel Demand Forecast Baseline Global Demand Forecast Under Disruption - Overall In the baseline forecast, global Steel Demand grows Global Steel Use by per annum to reach around billion tons 2500. Millions of tons of Steel (crude Steel equivalent). by 2035. 2000.
8 However after applying the estimates of the impact of disruptors the projection is that global Steel 1500. Demand will grows by per annum to reach billion tons by 2035 1000. In the Radical scenario, global Steel Demand grows 500. by per annum to reach billion tonnes by 2035, which is below the baseline forecast of 0. billion tonnes Summary Table: Apparent Steel use (Crude Steel equivalent, millions of tons) Baseline Incremental Radical EME/HM EME/LM DEV/HM DEV/LM China India Global 2015 44 315 113 276 672 80 1,500. Baseline 2035 2,000. CAGR 2015-2035 2015 44 315 113 276 672 80 1,500. EME/HM: Emerging/High Manu Incremental 2035 77 638 116 269 537 237 1,873 EME/LM: Emerging/Low Manu CAGR 2015-2035 DEV/HM: Developed/High Manu 2015 44 315 113 276 672 80 1,500 DEV/LM: Developed/Low Manu Radical 2035 71 593 104 248 504 228 1,749.
9 CAGR 2015-2035 Copyright 2017 Accenture All rights reserved. 16. Baseline Global Demand Forecast Under Disruption Per Capita In the Baseline scenario, global Steel per Global Steel Use per Capita capita increases to 263 kg per person by 300. 2035, but on a very flat curve 250. Kilograms of Steel per Person (crude Steel equivalent). In the Incremental scenario, global Steel 200. per capita increase to 246 kg per person by 2035, but is on a downward trajectory 150. 100. In the Radical scenario, global Steel per capita decreases to 229 kg per person by 50. 2035, which is 33 kg per person lower than 0. the baseline forecast of 263 kg per person Summary Table: Steel use per capita (kilograms per person) Baseline Incremental Radical EME/HM EME/LM DEV/HM DEV/LM China India Global 2015 173 204 703 321 497 61 235.
10 Baseline 2035 263. CAGR 2015-2035 EME/HM: Emerging/High Manu 2015 173 204 703 321 497 61 235 EME/LM: Emerging/Low Manu Incremental 2035 260 226 704 289 388 150 246 DEV/HM: Developed/High Manu CAGR 2015-2035 DEV/LM: Developed/Low Manu 2015 173 204 703 321 497 61 235. Radical 2035 239 208 636 267 365 145 229. CAGR 2015-2035 Copyright 2017 Accenture All rights reserved. 17. Steel Production & Raw Material Scenarios Global Steel Production The model was extended to consider different mixes of types of Steel production to project the relative supply- Demand balance of scrap this is the scenario assuming EAF production increases to 40% of total . in this scenario scrap consumption would be below potential scrap supply Crude Steel Production by Technology, Mt Balance of Scrap, Mt 2,200 1,000.