Transcription of Stock Market Briefing: NIPA vs. S&P 500 Profits
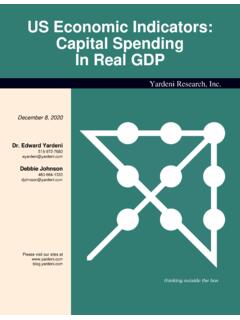
1 Corporate Finance Briefing: nipa vs . S&P 500 ProfitsYardeni Research, 11, 2020Dr. Edward visit our sites outside the boxTable Of ContentsTable Of ContentsTable Of ContentsDecember 11, 2020 / nipa vs . S&P 500 Profits Research, (NIPA)3-8 Profits ( nipa vs . S&P)9 Retained Earnings & Dividends10 Cash Flow11 Profit Margin12-1660 62 64 66 68 70 72 74 76 78 80 82 84 86 88 90 92 94 96 98 00 02 04 06 08 10 12 14 16 18 20 22 2475107520753075407550756075707580757510 752075307540755075607570758075Q3Q3 NOMINAL GNP & AFTER-TAX CORPORATE Profits (1960=100, ratio scale)Nominal GNP7% Growth Path*After-Tax Corporate ProfitsReported to IRSFrom Current Production** Compounded monthly to yield 7% annually.
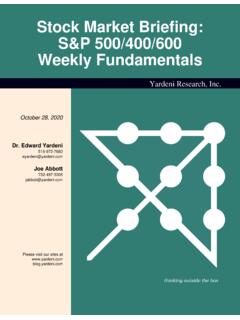
2 ** Including Inventory Valuation Adjustment (IVA) and Capital Consumption Adjustment (CCAdj), which restate the historical cost basis used in profitstax accounting for inventory withdrawals and depreciation to the current cost measures used in : Bureau of Economic 62 64 66 68 70 72 74 76 78 80 82 84 86 88 90 92 94 96 98 00 02 04 06 08 10 12 14 16 18 20 22 24353103153203253303353103153203253303 NovQ3S&P 500 EARNINGS PER SHARE(dollars, ratio scale)S&P 500 Earnings Per Share*Reported(4-quarter sum)Operating**(4-quarter sum)Forward**7%5%* Growth paths are compounded monthly to yield 5% and 7% annually.
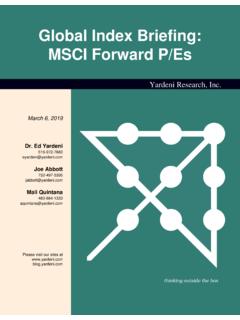
3 ** Excludes write-offs.** S&P 500 12-month forward consensus expected operating earnings per share. Time-weighted average of consensus earnings estimates forcurrent and next : Standard & Poor s and I/B/E/S data by 1 / December 11, 2020 / nipa vs . S&P 500 Profits Research, 62 64 66 68 70 72 74 76 78 80 82 84 86 88 90 92 94 96 98 00 02 04 06 08 10 12 14 16 18 20 22 2475107520753075407550756075707580757510 752075307540755075607570758075Q3 NOMINAL GDP & AFTER-TAX CORPORATE Profits (1960=100, ratio scale)7% Growth Path*After-Tax Corporate ProfitsReported to IRSFrom Current Production** Compounded monthly to yield 7% annually.
4 ** Including Inventory Valuation Adjustment (IVA) and Capital Consumption Adjustment (CCAdj), which restate the historical cost basis used in profitstax accounting for inventory withdrawals and depreciation to the current cost measures used in : Bureau of Economic 500 FORWARD EARNINGS*& 7% Growth Trend(ratio scale)12/3S&P 500 Forward Earnings ( )7% Trend** 52-week forward consensus expected S&P 500 operating earnings per share. Monthly through April 1994, then weekly.** Compounded monthly to yield 7% : Shaded areas denote recessions according to the National Bureau of Economic : I/B/E/S data by 2 / December 11, 2020 / nipa vs .
5 S&P 500 Profits Research, 50 52 54 56 58 60 62 64 66 68 70 72 74 76 78 80 82 84 86 88 90 92 94 96 98 00 02 04 06 08 10 12 14 16 18 20 22 2410410810121016102010241028101041081012 101610201024102810Q3 CORPORATE Profits FROM CURRENT PRODUCTION*(billion dollars, saar, ratio scale)Total ProfitsPre-TaxAfter-Tax* Including Inventory Valuation Adjustment (IVA) and Capital Consumption Adjustment (CCAdj), which restate the historical cost basis used in profitstax accounting for inventory withdrawals and depreciation to the current cost measures used in.
6 Bureau of Economic 50 52 54 56 58 60 62 64 66 68 70 72 74 76 78 80 82 84 86 88 90 92 94 96 98 00 02 04 06 08 10 12 14 16 18 20 22 2410510101015102010251030101051010101510 201025103010Q3 CORPORATE Profits REPORTED TO IRS*(billion dollars, saar, ratio scale)Total ProfitsPre-TaxAfter-Tax* Excluding Inventory Valuation Adjustment (IVA) and Capital Consumption Adjustment (CCAdj), which restate the historical cost basis used in profitstax accounting for inventory withdrawals and depreciation to the current cost measures used in : US Department of Commerce, Bureau of Economic (NIPA)Page 3 / December 11, 2020 / nipa vs .
7 S&P 500 Profits Research, 50 52 54 56 58 60 62 64 66 68 70 72 74 76 78 80 82 84 86 88 90 92 94 96 98 00 02 04 06 08 10 12 14 16 18 20 22 24-50050100-50050100Q3 CORPORATE Profits FROM CURRENT PRODUCTION*(yearly percent change)Total ProfitsAfter-Tax ( )* Including Inventory Valuation Adjustment (IVA) and Capital Consumption Adjustment (CCAdj), which restate the historical cost basis used in profitstax accounting for inventory withdrawals and depreciation to the current cost measures used in : US Department of Commerce, Bureau of Economic 50 52 54 56 58 60 62 64 66 68 70 72 74 76 78 80 82 84 86 88 90 92 94 96 98 00 02 04 06 08 10 12 14 16 18 20 22 24-60-40-20020406080100120140-60-40-2002 0406080100120140Q3 CORPORATE Profits REPORTED TO IRS*(yearly percent change)Total ProfitsAfter-Tax ( )* Excluding Inventory Valuation Adjustment (IVA) and Capital Consumption Adjustment (CCAdj), which restate the historical cost basis used in profitstax accounting for inventory withdrawals and depreciation to the current cost measures used in.
8 US Department of Commerce, Bureau of Economic (NIPA)Page 4 / December 11, 2020 / nipa vs . S&P 500 Profits Research, 62 64 66 68 70 72 74 76 78 80 82 84 86 88 90 92 94 96 98 00 02 04 06 08 10 12 14 16 18 20 22 24-20002004006008001000120014001600-2000 2004006008001000120014001600Q3 CORPORATE Profits BY INDUSTRY*(billion dollars, saar)Pre-Tax By IndustryFinancialNonfinancialNet Receipts from the Rest of the World* Including Inventory Valuation Adjustment (IVA) and Capital Consumption Adjustment (CCAdj), which restate the historical cost basis used in profitstax accounting for inventory withdrawals and depreciation to the current cost measures used in.
9 US Department of Commerce, Bureau of Economic 62 64 66 68 70 72 74 76 78 80 82 84 86 88 90 92 94 96 98 00 02 04 06 08 10 12 14 16 18 20 22 24-20020406080100-20020406080100Q3 CORPORATE Profits BY INDUSTRY*(as a percent of corporate Profits )Pre-Tax By IndustryFinancialNonfinancialNet Receipts from the Rest of the World* Including Inventory Valuation Adjustment (IVA) and Capital Consumption Adjustment (CCAdj), which restate the historical cost basis used in profitstax accounting for inventory withdrawals and depreciation to the current cost measures used in : US Department of Commerce, Bureau of Economic (NIPA)Page 5 / December 11, 2020 / nipa vs .
10 S&P 500 Profits Research, 86 87 88 89 90 91 92 93 94 95 96 97 98 99 00 01 02 03 04 05 06 07 08 09 10 11 12 13 14 15 16 17 18 19 20 21 22 23 24-150-100-50050100150200250300350400450 500550-150-100-5005010015020025030035040 0450500550Q312/3Q3 MEASURES OF Profits IN FINANCIAL SECTOR(billion dollars)Pre-Tax Profits : Financial*(saar)S&P 500 Financials12-month Forward EarningsFDIC Commercial Banks: Net Income(annualized, nsa)* Including Inventory Valuation Adjustment (IVA) and Capital Consumption Adjustment (CCAdj), which restate the historical cost basis used in profitstax accounting for inventory withdrawals and depreciation to the current cost measures used in.