Transcription of Stock Market Briefing: Selected P/E Ratios
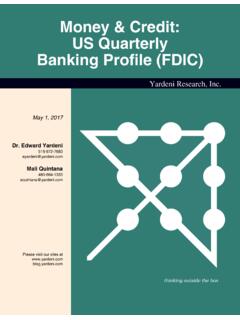
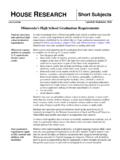
1 Stock Market Briefing: Selected P/E RatiosYardeni Research, 11, 2022Dr. Edward visit our sites outside the boxTable Of ContentsTable Of ContentsTable Of ContentsFebruary 11, 2022 / Stock Market briefing : Selected P/E Ratios Research, Forward P/E: S&P 5004 Forward P/E: Russell 20005P/E & PEG: S&P 5006 Trailing P/E7P/E8-9 Forward P/E: Growth vs Value10-11 Miscellaneous12-16 Figure P/E Ratios FOR S&P INDEXES*(daily)2/9S&P 500 LargeCap ( )990001020304050607080910111213141516171 8192021222324810121416182022248101214161 82022242/9S&P 400 MidCap ( )990001020304050607080910111213141516171 8192021222324810121416182022242628810121 4161820222426282/9S&P 600 SmallCap ( )* Price divided by 52-week forward consensus expected operating earnings per share.
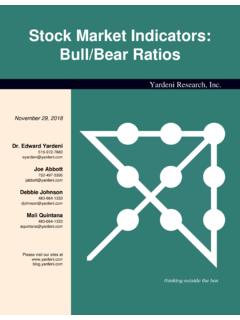
2 Note: Shaded red areas are S&P 500 bear Market declines of 20% or more. Blue shaded areas are correction declines of 10% to less than 20%. Yellow areas are bull markets. Source: I/B/E/S data by Refinitiv and Standard & Poor 1 / February 11, 2022 / Stock Market briefing : Selected P/E Ratios Research, 2000 2001 2002 2003 2004 2005 2006 2007 2008 2009 2010 2011 2012 2013 2014 2015 2016 2017 2018 2019 2020 2021 2022 2023 202481216202428328121620242832 FORWARD P/E Ratios FOR S&P 500 INDEXES*(weekly)2/4S&P 500 LargeCap ( )1999 2000 2001 2002 2003 2004 2005 2006 2007 2008 2009 2010 2011 2012 2013 2014 2015 2016 2017 2018 2019 2020 2021 2022 2023 20248121620248121620242/4S&P 400 MidCap ( )1999 2000 2001 2002 2003 2004 2005 2006 2007 2008 2009 2010 2011 2012 2013 2014 2015 2016 2017 2018 2019 2020 2021 2022 2023 202481216202428812162024282/4S&P 600 SmallCap ( )
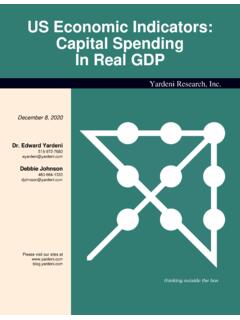
3 * Weekly Stock price index divided by 52-week forward consensus expected operating earnings per share Note: Shaded red areas are S&P 500 bear Market declines of 20% or more. Yellow areas show bull markets. Source: I/B/E/S data by Refinitiv and Standard & Poor 2 / February 11, 2022 / Stock Market briefing : Selected P/E Ratios Research, 2005 2006 2007 2008 2009 2010 2011 2012 2013 2014 2015 2016 2017 2018 2019 2020 2021 2022 2023 2024810121416182022242628810121416182022 242628 FORWARD P/E Ratios FOR S&P Stock PRICE INDEXES*(daily)2/11S&P Forward P/EsS&P 500 ( )S&P 400 ( )S&P 600 ( )* Daily Stock price index divided by 52-week forward consensus expected operating earnings per.
4 Standard & Poor s and I/B/E/S data by 2000 2001 2002 2003 2004 2005 2006 2007 2008 2009 2010 2011 2012 2013 2014 2015 2016 2017 2018 2019 2020 2021 2022 2023 2024810121416182022242628308101214161820 2224262830 FORWARD P/E Ratios FOR S&P INDEXES*(weekly)2/4S&P 500 LargeCap ( )S&P 400 MidCap ( )S&P 600 SmallCap ( )* Price divided by 52-week forward consensus expected operating earnings per : Shaded red areas are S&P 500 bear Market declines of 20% or more. Yellow areas show bull : I/B/E/S data by 3 / February 11, 2022 / Stock Market briefing : Selected P/E Ratios Research, P/E RATIO FOR S&P 500 (MEDIAN) 500 Median Forward P/E ( )Note: Shaded red areas are S&P 500 bear Market declines of 20% or more.
5 Yellow areas show bull : I/B/E/S data by P/E Ratios FOR S&P 500 (ACTUAL & MEDIAN)JanS&P 500 Forward P/E Ratio* ( )S&P 500 Median Forward P/E ( )* Average weekly price divided by 52-week forward consensus expected operating earnings per : Shaded red areas are S&P 500 bear Market declines of 20% or more. Yellow areas show bull : I/B/E/S data by Forward P/E: S&P 500 Page 4 / February 11, 2022 / Stock Market briefing : Selected P/E Ratios Research, 2004 2005 2006 2007 2008 2009 2010 2011 2012 2013 2014 2015 2016 2017 2018 2019 2020 2021 2022 2023 202410203040506070102030405060702/3 FORWARD P/E Ratios FOR RUSSELL 2000*(weekly)P/E capped at 60 due to extreme 2000 ( )Russell 2000 Growth ( )Russell 2000 Value ( )* Price divided by 12-month (52-week) forward consensus expected operating earnings per share.
6 Monthly data through December 2005, weekly : I/B/E/S data by P/E Ratios FOR US SMALLCAP*(weekly)2/3P/E capped at 35due to extreme 2000 ( )S&P 600 SmallCap ( )* Price divided by 12-month (52-week) forward consensus expected operating earnings per share. Monthly data through December 2005, weekly : I/B/E/S data by P/E: Russell 2000 Page 5 / February 11, 2022 / Stock Market briefing : Selected P/E Ratios Research, 62 64 66 68 70 72 74 76 78 80 82 84 86 88 90 92 94 96 98 00 02 04 06 08 10 12 14 16 18 20 22 24 2646810121416182022242628304681012141618 202224262830S&P 500 P/E(using reported trailing earnings 1960-1978 forward earnings* 1979-present)2/32/3 Latest ( )* Time-weighted average of consensus estimates of S&P 500 operating earnings per share for current year and next year.
7 Monthly from January 1979through April 1994, then : Shaded areas are recessions according to the National Bureau of Economic : I/B/E/S data by Refinitiv and Standard & Poor 500 VALUATION: PEG RATIODec2 Ratio* ( )* Forward P/E divided by LTEG, which is 5-year forward consensus expected annual earnings growth. Monthly through 2005, then : Shaded red areas are S&P 500 bear Market declines of 20% or more. Yellow areas show bull : I/B/E/S data by Refinitiv .Figure & PEG: S&P 500 Page 6 / February 11, 2022 / Stock Market briefing : Selected P/E Ratios Research, 37 39 41 43 45 47 49 51 53 55 57 59 61 63 65 67 69 71 73 75 77 79 81 83 85 87 89 91 93 95 97 99 01 03 05 07 09 11 13 15 17 19 21 23 25 270102030405001020304050P/E RATIO FOR S&P 500(Using Trailing Reported Earnings)*Q3 Capped at 45 due to extreme values* Using 4-quarter trailing reported : Shaded red areas are S&P 500 bear Market declines of 20% or more.
8 Yellow areas show bull : Standard & Poor 90 91 92 93 94 95 96 97 98 99 00 01 02 03 04 05 06 07 08 09 10 11 12 13 14 15 16 17 18 19 20 21 22 23 2481216202428328121620242832S&P 500 P/E RATIOSQ3 JanS&P 500 P/EsTrailing (using operating earnings)* ( )Forward** ( )* Using quarterly average of daily data for S&P 500 price index, and 4-quarter trailing operating earnings (I/B/E/S data).** S&P 500 Stock price index divided by S&P 500 12-month forward analysts consensus expected operating earnings per : Shaded red areas are S&P 500 bear Market declines of 20% or more. Yellow areas show bull : I/B/E/S data by Refinitiv and Standard & Poor P/EPage 7 / February 11, 2022 / Stock Market briefing : Selected P/E Ratios Research, 62 64 66 68 70 72 74 76 78 80 82 84 86 88 90 92 94 96 98 00 02 04 06 08 10 12 14 16 18 20 22 2401020304050600102030405060US EQUITY Market CAPITALIZATION: NONFINANCIAL CORPORATIONS(as a ratio of NFC after-tax profits from current production*)Q3* Including IVA and CCadj.
9 These two adjustments restate the historical cost basis used in profits tax accounting for inventory withdrawals and depreciation to the current cost measures used in : Shaded red areas are S&P 500 bear Market declines of 20% or more. Yellow areas show bull : Haver 62 64 66 68 70 72 74 76 78 80 82 84 86 88 90 92 94 96 98 00 02 04 06 08 10 12 14 16 18 20 22 2405101520253035400510152025303540US EQUITY Market CAPITALIZATION EXCLUDING FOREIGN ISSUES(as a ratio of NFC after-tax profits from current production*)Q3Q3As a ratio of:After-Tax Profits from Current Production* (Avg = )Corporate Cash Flow** (Avg = )* Including IVA and CCadj.
10 These two adjustments restate the historical cost basis used in profits tax accounting for inventory withdrawals anddepreciation to the current cost measures used in GDP.** After-tax operating retained earnings plus tax-return-based : Shaded red areas are S&P 500 bear Market declines of 20% or more. Yellow areas show bull : Thomson Reuters I/B/E/S, Bureau of Economic Analysis, Federal Reserve Board Flow of Funds Accounts, and Standard & Poor 8 / February 11, 2022 / Stock Market briefing : Selected P/E Ratios Research, 91 92 93 94 95 96 97 98 99 00 01 02 03 04 05 06 07 08 09 10 11 12 13 14 15 16 17 18 19 20 21 22 23 245152535455551525354555 FORWARD P/E Ratios FOR S&P 500 Stock PRICE INDEX*(weekly)2/3S&P 500 ( )S&P 500 Technology ( )* Stock price index divided by forward consensus expected operating earnings per share.