Transcription of Sub-Saharan Africa - World Bank
1 Sub-Saharan Africa Rate (%)National Poverty Poverty in Angolan kwanza (2018) or US$ (2011 PPP) per day per capitaLower Middle Income Class Poverty in Angolan kwanza (2018) or US$ (2011 PPP) per day per capitaUpper Middle Income Class Poverty in Angolan kwanza (2018) or US$ (2011 PPP) per day per capitaMultidimentional Poverty PROSPERITYA nnualized Income or Consumption Growth per capita of the bottom 40 percentN/AN/AINEQUALITYGini Prosperity Premium = Growth of the bottom 40 - Average GrowthN/AN/AGROWTHA nnualized GDP per capita growth Income or Consumption Growth per capita from Household SurveyN/AN/AMEDIAN INCOMEG rowth of the annual median income/consumption per capitaN/AN/ASources: WDI for GDP, National Statistical Offices for national poverty rates, POVCALNET as of Feburary 2020, and Global Monitoring Database for the rest.
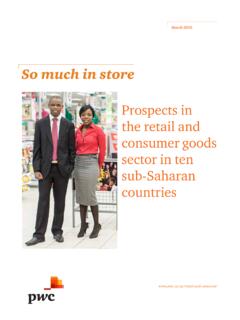
2 Between2008-2009and2018-2019,thepercento fpeoplebelowthenationalpovertylinechange dfrom37percentto41percent(datasource:IDR 2018-2019).Duringthesameperiod, (IDREA2018-2019)andthenewnationalpoverty line,theincidenceofpovertyinAngolaisat32 percentnationally, ,lessthan10percentofthepopulationisbelow thepovertyline,whereastheprovincesofCune ne(54percent),Moxico(52percent)andKwanza Sul(50percent)havemuchhigherprevalenceof significant progress toward macroeconomic stability and adopting much needed structural reforms, estimates suggest $ (2011 PPP). , & Equity BriefAngolaSub- saharan AfricaApril Economist: Carlos da Maia(million)Number of INDICATORSI nternational Poverty Line(%)Non-PoorPoorBottom 40 Top 60 Urban population68322476 Monetary poverty (Consumption)Rural population27736535 Daily consumption less than US$ per least one school-aged child is not enrolled in to 14 years old46544654No adult has completed primary to 64 years old59413466 Access to basic infrastructure65 and older56443565No access to limited-standard drinking education (16+)33675842No access to limited-standard education (16+)43574852No access to education (16+)74261981 Tertiary/post-secondary education (16+)964397 Source: World Bank using IDREA/SSAPOV/GMDS ource.
3 World Bank using IDREA/SSAPOV/GMDN otes: N/A missing value, N/A* value removed due to less than 30 observationsPOVERTY DATA AND METHODOLOGYHARMONIZATIONSub- saharan HEADCOUNT RATE, 2000-2018 INEQUALITY TRENDS, 2000-2018 Source: World Bank using IDREA/SSAPOV/GMDS ource: World Bank using IDREA/SSAPOV/GMDI nstitutoNacionaldeEstat stica(INE)inAngolaoverseesthecollectiono fhouseholdbudgetsurveys(HBS) (2000and2008-2009) , ,theINEconductedtwohouseholdbudgetsurvey sinparallel,(i)Inqu ritosobreDespesaseReceitas(IDR2018-2019) ,fundedbytheGovernmentofAngolaand(ii)Inq u ritodeDespesas,ReceitaseEmpregoemAngola( IDREA2018-2019), ritoIntegradosobreoBem-EstardaPopula o(IBEP2008-2009) ,povertynumbersbasedonIBEP2008-2009areno t comparable to those based on IDREA ' group (%) the database are Eritrea, Equatorial Guinea, and Somalia.
4 Terms of use of the data adhere to agreements with the original data among groups: 2018 Multidimensional Poverty Measures (% of people): 2018 Gini IndexPoverty rate (%)GDP per capita (Thousand)012345678010203040506070809010 0200020022004200620082010201220142016201 8 International Poverty LineLower Middle IC LineUpper Middle IC LineNational Poverty Rate (%)National Poverty Poverty in CFA franc (2015) or US$ (2011 PPP) per day per capitaLower Middle Income Class Poverty in CFA franc (2015) or US$ (2011 PPP) per day per capitaUpper Middle Income Class Poverty in CFA franc (2015) or US$ (2011 PPP) per day per capitaMultidimentional Poverty PROSPERITYA nnualized Consumption Growth per capita of the bottom 40 Prosperity Premium = Growth of the bottom 40 - Average GDP per capita growth Consumption Growth per capita from Household INCOMEG rowth of the annual median income/consumption per : WDI for GDP, National Statistical Offices for national poverty rates, POVCALNET as of Feburary 2020, and Global Monitoring Database for the rest.
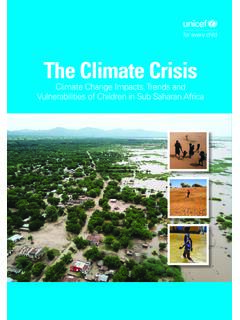
5 , ,usingthesameofficialconsumptionaggregat esandapplyingthe$ (2011 PPP) (2011-2015). ,thesefactorsallpointtoadeclineinpoverty between2006and2010, , ( ), $ ,theGiniindexcommonlyusedtomeasureinequa litywasestimated at , which suggests relatively elevated levels of inequality in the ,Benin' ,includingadequatenutrition, ,with32percentofchildrenunder5stunted(35 percentinruralareaversus28percentinurban area).Accesstosafelymanagedwaterandsanit ationisimproving(morethan7householdsouto f10haveaccesstoimprovedwatersourceswhile halfofthemdonothavetoilets),and37percent ofhouseholdshaveaccesstoelectricity(only onefifthinruralarea).TheMultidimensional PovertyMeasurement(MPM) (EMICoV2015).
6 Thishighratesuggeststhatnon-monetarypove rtyindicators,continuetoposemajorchallen ges,despitesteadyimprovements,forthewell -beingofBeninese & Equity BriefBeninSub- saharan AfricaApril Economist: Felicien Donat Edgar Towenan Accrombessy(million)Number of INDICATORSI nternational Poverty Line(%)Non-PoorPoorBottom 40 Top 60 Urban population64362872 Monetary poverty (Consumption)Rural population40605050 Daily consumption less than US$ per least one school-aged child is not enrolled in to 14 years old44564654No adult has completed primary to 64 years old56443565 Access to basic infrastructure65 and older57433466No access to limited-standard drinking education (16+)47534357No access to limited-standard education (16+)63372971No access to education (16+)71292278 Tertiary/post-secondary education (16+)8812991 Source.
7 World Bank using EMICOV/SSAPOV/GMDS ource: World Bank using EMICOV/SSAPOV/GMDN otes: N/A missing value, N/A* value removed due to less than 30 observationsPOVERTY DATA AND METHODOLOGYHARMONIZATIONSub- saharan HEADCOUNT RATE, 2003-2015 INEQUALITY TRENDS, 2003-2015 Source: World Bank using EMICOV/SSAPOV/GMDS ource: World Bank using EMICOV/SSAPOV/GMDB enincompletedaCoreWelfareIndicatorsQuest ionnaire(CWIQ)surveyin2003,andsince2006i mplementsIntegratedModularHouseholdLivin gConditionsSurvey(EMICoV)basedon18,000to 20,000+households(2006,2007,2010,2011,an d2015).Benincalculatesover140povertyline s,representativeat77urban/ruralCommunes' ,thisapproachmeetsthegovernment' ' ( $2011 PPP,usedforinternationalcomparisons)ares imilar,thoughlevelsaredifferent( ), ,andupdatestopovertytrendsexpectedinthef irstquarter2020, (EMICoV2010-2015) ,theWorldBankispreparingjointlywiththeNS Oahighfrequencymobile phone survey to help the government and and partners monitoring the impact of the pandemic on group (%) the database are Eritrea, Equatorial Guinea, and Somalia.
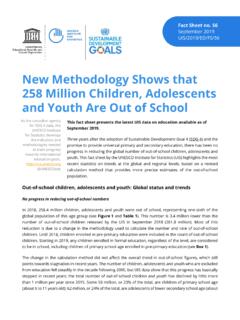
8 Terms of use of the data adhere to agreements with the original data among groups: 2015 Multidimensional Poverty Measures (% of people): 2015 Gini IndexPoverty rate (%)GDP per capita (Thousand) Poverty LineLower Middle IC LineUpper Middle IC LineNational Poverty Rate (%)National Poverty Poverty in Botswana pula (2015) or US$ (2011 PPP) per day per capitaLower Middle Income Class Poverty in Botswana pula (2015) or US$ (2011 PPP) per day per capitaUpper Middle Income Class Poverty in Botswana pula (2015) or US$ (2011 PPP) per day per capitaMultidimentional Poverty PROSPERITYA nnualized Consumption Growth per capita of the bottom 40 Prosperity Premium = Growth of the bottom 40 - Average GDP per capita growth Consumption Growth per capita from Household INCOMEG rowth of the annual median income/consumption per : WDI for GDP, National Statistical Offices for national poverty rates, POVCALNET as of Feburary 2020, and Global Monitoring Database for the rest.
9 LivingconditionshaveimprovedfortheBotswa napeople, $ , of increasing agricultural incomes, including subsidies, and demographic changes. , ,Botswana'sperformancewasonlyinthemiddle oftheworldwideshared-prosperity distribution. Between2010and2015,inequality,measuredby theGiniindex,alsofell, ,Botswanaremainsoneoftheworld's most unequal will have to scale up support to the most vulnerable members of & Equity BriefBotswanaSub- saharan AfricaApril , Economist: Precious Zikhali(thousand)Number of INDICATORSI nternational Poverty Line(%)Non-PoorPoorBottom 40 Top 60 Urban population89113169 Monetary poverty (Consumption)Rural population75255743 Daily consumption less than US$ per least one school-aged child is not enrolled in to 14 years old78225248No adult has completed primary to 64 years old87133367 Access to basic infrastructure65 and older85154456No access to limited-standard drinking education (16+)77235545No access to limited-standard education (16+)84164159No access to education (16+)87133466 Tertiary/post-secondary education (16+)973991 Source: World Bank using BMTHS/SSAPOV/GMDS ource.
10 World Bank using BMTHS/SSAPOV/GMDN otes: N/A missing value, N/A* value removed due to less than 30 observationsPOVERTY DATA AND METHODOLOGYHARMONIZATIONSub- saharan HEADCOUNT RATE, 2002-2015 INEQUALITY TRENDS, 2002-2015 Source: World Bank using BMTHS/SSAPOV/GMDS ource: World Bank using BMTHS/SSAPOV/GMDB otswana' (PDL),whichisbasedonthecostofabasket of goods and services deemed to be necessary and adequate to meet basic needs for household members. Potentialsourcesofdifferencebetweennatio nalpovertyincidenceandinternationalpover tyincidence( )include:(1)valueofthepovertylineinLCU(t henationalaveragePDLperhouseholdpermonth in2009-10is882pula,andtheinternationalpo vertylineperhouseholdpermonthisapproxima tely768pula); and (2) adjustment for cost of living differences across space for the national poverty estimates but not in international poverty (RAS),theStatisticsBotswana is planning to conduct a Continuous Multi-Topic Household Survey in 2019.