Transcription of Suicide in the workplace - Bureau of Labor Statistics
1 1 Reginald Harris Harris is an economist in the Branch of Occupational Safety and Health Statistics , Office of Field Operations, Atlanta Regional Office, Bureau of Labor in the workplaceWorkplace Suicide is a tragic phenomenon that has grown in recent years in the United States. This article uses Census of Fatal Occupational Injuries data to examine how the frequency of workplace suicides has changed over time and to analyze the distribution of workplace suicides among selected demographic groups and case categories. It introduces propensity ratios as a tool for measuring and comparing the proportional share of workplace suicides among in the workplace is a growing concern. According to the Bureau of Labor Statistics (BLS) Census of Fatal Occupational Injuries (CFOI), 282 workplace suicides occurred in 2013, the highest number recorded since the CFOI series began in An analysis of workplace suicides, 1992 2001, Stephen Pegula compared different ways of evaluating the prevalence of workplace Suicide among various groups in the Labor force.
2 Using traditional incidence rates, he found that workplace Suicide occurred most frequently among Whites, men, 35-to-44-year-olds, and wage and salary workers. However, applying relative risk ratios that is, ratios that show how much more or less likely a worker in a particular group is to suffer a workplace fatality compared with the average worker Pegula found that, although Whites and men still experienced the highest relative levels of workplace Suicide , those over 54 years of age and the self-employed experienced the highest relative Suicide In his examination of occupational groups, Pegula found that, while managerial and professional specialty occupations had the highest counts for workplace suicides, relative risk was highest for farming, forestry, and fishing occupations. Among detailed occupations, police and detectives in public service had the highest relative risk of workplace article analyzes CFOI data and propensity ratios to describe trends in workplace Suicide .
3 It extends Pegula s earlier work by examining the more recent 2011 13 period and expands his work by introducing propensity ratios as a complementary measure for analysis. This article begins with a broad look at how workplace suicides have increased over time. Next, it describes propensity ratios and shows how they are calculated. After that, CFOI data and propensity ratios are presented to compare the prevalence of workplace Suicide among different demographic December 2016 Bureau OF Labor STATISTICS2 MONTHLY Labor REVIEW groups, major occupational groups, and detailed occupations. Lastly, the article briefly discusses the relationship between military affiliation and workplace Suicide over timeThe rise in workplace suicides is consistent with the rise in the overall number of suicides in the United States.
4 The Centers for Disease Control and Prevention (CDC) reported that there were 41,149 total suicides in the United States in 2013, compared with 29,199 in 1999 an increase of about 41 percent. During this 15-year period, the number of suicides increased every year but one (2003). According to the CDC, the Suicide rate was (per 100,000) in 1999, dipped to in 2000, and rose to by Suicide was the tenth leading cause of all deaths in the United States in 2013, and occurred more than twice as frequently as However, suicides were less likely to occur at the workplace than homicides. Although workplace homicides have declined over time, they occurred about 43 percent more frequently than workplace suicides in suicides have increased in recent years, even as the overall number of workplace fatalities have steadily declined.
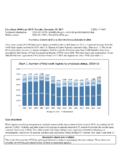
5 In 1992, 205 workplace suicides occurred, representing about 3 percent of the 6,217 total workplace fatalities. In 2013, 282 workplace suicides occurred, representing about 6 percent of the 4,585 total workplace fatalities. The fewest workplace suicides, 180, occurred in 2005. From 2007 to 2008, the number of workplace suicides increased by about 34 percent, from 196 to 263, and has remained elevated. (See figure 1.) workplace suicides are unique among workplace fatalities because, unlike other workplace fatalities, they occur intentionally and are often prompted by a variety of causal factors and circumstances that are not always easy to determine. Information about individual Suicide cases is sometimes sparse, making it difficult for the CFOI to identify and classify such cases. Determining whether suicides are workplace related can be difficult as well.
6 For example, suicides by employees who work from home may be particularly challenging to classify. If the Suicide occurred in the home office, the motive may be entirely unrelated to work. If the Suicide occurred somewhere in the Bureau OF Labor STATISTICS3 MONTHLY Labor REVIEW home, but outside of the home office, there may be evidence that the Suicide was related to business conditions or a workplace Suicide to be included in the CFOI, at least one of the following criteria must be met: (1) the death arose from an injury at the decedent s work premises while the decedent was there for work; (2) the death occurred away from the work premises, but the decedent was engaged in work activity ( , performing work at a client s premises); or (3) the death was related to the decedent s work status ( , a Suicide at home that can be definitively linked back to work).
7 Note that unintentional drug overdoses are not counted as suicides, but they are counted as another type of workplace fatality if they meet CFOI work relationship criteria. The CFOI applies a uniform set of rules to determine whether a fatality is to be considered a workplace annual counts of workplace suicides are available from 1992 to 2013 and are used for the trend analysis in this article. The detailed analysis of the current risks of workplace Suicide is based on data from 2011 through 2013, because 2011 marks the first year that CFOI data were classified in accordance with the Occupational Injury and Illness Classification System (OIICS), version ; the OIICS version data are generally not comparable with data from the original counts, rates, and propensity ratiosThe CFOI publishes workplace fatality counts by various characteristics, including gender, race, occupation, event, and state of incident.
8 These counts provide an overall understanding of workplace risks and give insight into the circumstances surrounding workplace deaths. For example, if transportation accidents account for the greatest number of workplace fatalities and if heavy-truck drivers are involved in most of those accidents, then reducing transportation accidents by heavy-truck drivers might result in a significant reduction in the overall number of workplace also publishes fatal injury rates by demographic and case-characteristic categories. Expressed as a count per 100,000 full-time equivalent workers, based on Current Population Survey (CPS) estimates of hours worked,6 these rates are useful for understanding whether the workplace fatality count for a particular group is relatively high or low. For example, 20 work-related suicides for an occupation with more than 1,000,000 workers would be evaluated differently than the same number of suicides for an occupation with fewer than 10,000 workers.
9 The absolute count of fatal work injuries is the same for both groups, but the corresponding relative incidence rates for the two are very ratios can shed light on differences in the composition or distribution of types of cases for groups sorted by demographic and case-characteristic categories. For example, suppose that from 2011 to 2013, 20 workplace suicides were committed by workers in an occupation that had 100 total workplace fatalities. This would mean that, during a period where only about 6 percent of all workplace fatalities were suicides, 20 percent of the workplace fatalities for this particular occupation were suicides. The distributional share of suicides suffered may be of greater interest to researchers than the absolute count or incidence a propensity ratio is a straightforward calculation of CFOI counts, it is a convenient tool for analyzing hazards and making comparisons among groups.
10 It does not replace the robust measures of fatal injury rates or relative risk ratios, but is a complementary tool that can lead to additional insights or fill gaps when other analytical tools are not suitable. For example, because hours-worked data related to military occupations are not available Bureau OF Labor STATISTICS4 MONTHLY Labor REVIEW from the CPS, fatal injury rates for military occupations and relative risk ratios that require those rates cannot be calculated. But with propensity ratios, it is possible to make limited comparisons of military occupations with other major occupational propensity ratio is calculated by dividing the percentage of an attribute occurring in a specific group by the percentage of the specific group in the population. The formula for calculating propensity ratios for workplace suicides follows: (1)Where:P = Propensity ratioSx = workplace suicides attributed to a group (x)S = All workplace suicidesFx = workplace fatalities attributed to a group (x)F = All workplace fatalitiesEquation (1) can be rewritten in the following form, which adds an intuitive interpretation to the propensity ratio: (2)Propensity ratios higher than indicate a higher propensity for an attribute; propensity ratios lower than indicate a lower propensity an the attribute.

