Transcription of Summary of Economic Projections
1 For release at 2:00 , EST, December 15, 2021 Summary of Economic ProjectionsIn conjunction with the Federal Open Market Committee (FOMC) meeting held onDecember 14 15, 2021, meeting participants submitted their Projections of the mostlikely outcomes for real gross domestic product (GDP) growth, the unemploymentrate, and inflation for each year from 2021 to 2024 and over the longer run. Eachparticipant s Projections were based on information available at the time of the meeting,together with her or his assessment of appropriate monetary policy including a pathfor the federal funds rate and its longer-run value and assumptions about otherfactors likely to affect Economic outcomes. The longer-run Projections represent eachparticipant s assessment of the value to which each variable would be expected toconverge, over time, under appropriate monetary policy and in the absence of furthershocks to the economy.
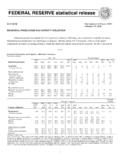
2 Appropriate monetary policy is defined as the future path ofpolicy that each participant deems most likely to foster outcomes for Economic activityand inflation that best satisfy his or her individual interpretation of the statutorymandate to promote maximum employment and price 1 of 17 For release at 2:00 , EST, December 15, 2021 Table 1. Economic Projections of Federal Reserve Board members and Federal Reserve Bank presidents,under their individual assumptions of projected appropriate monetary policy, December 2021 Median1 Central Tendency2 Range32021 2022 2023 2024 Longerrun2021202220232024 Longerrun2021202220232024 LongerrunChangein real PCE :Projectedappropriate policy pathFederal funds.
3 Projections of change in real gross domestic product (GDP) and Projections for both measures of inflation are percent changes from the fourth quarter ofthe previous year to the fourth quarter of the year indicated. PCE inflation and core PCE inflation are the percentage rates of change in, respectively, the price indexfor personal consumption expenditures (PCE) and the price index for PCE excluding food and energy. Projections for the unemployment rate are for the averagecivilian unemployment rate in the fourth quarter of the year indicated. Each participant s Projections are based on his or her assessment of appropriate monetarypolicy. Longer-run Projections represent each participant s assessment of the rate to which each variable would be expected to converge under appropriate monetarypolicy and in the absence of further shocks to the economy.
4 The Projections for the federal funds rate are the value of the midpoint of the projected appropriatetarget range for the federal funds rate or the projected appropriate target level for the federal funds rate at the end of the specified calendar year or over the longerrun. The September Projections were made in conjunction with the meeting of the Federal Open Market Committee on September 21 22, 2021. One participant didnot submit longer-run Projections for the change in real GDP, the unemployment rate, or the federal funds rate in conjunction with the September 21 22, 2021,meeting, and one participant did not submit such Projections in conjunction with the December 14 15, 2021, For each period, the median is the middle projection when the Projections are arranged from lowest to highest.
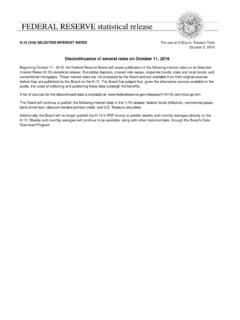
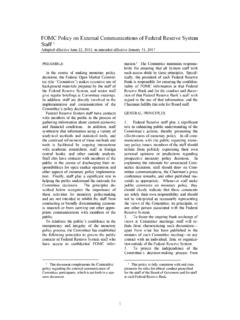
5 When the number of Projections is even, themedian is the average of the two middle The central tendency excludes the three highest and three lowest Projections for each variable in each The range for a variable in a given year includes all participants Projections , from lowest to highest, for that variable in that Longer-run Projections for core PCE inflation are not 2 of 17 For release at 2:00 , EST, December 15, 2021 Figure1. Medians, central tendencies, and ranges of Economic Projections , 2021 24 and over the longer run 3 2 1012345672016201720182019202020212022202 32024 Median of projectionsCentral tendency of projectionsRange of projectionsActualPercentChange in real GDPL ongerrun12345678201620172018201920202021 202220232024 PercentUnemployment rateLongerrun123456201620172018201920202 021202220232024 PercentPCE inflationLongerrun1234562016201720182019 20202021202220232024 PercentCore PCE inflationLongerrunNote: Definitions of variables and other explanations are in the notes to table 1.
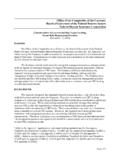
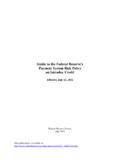
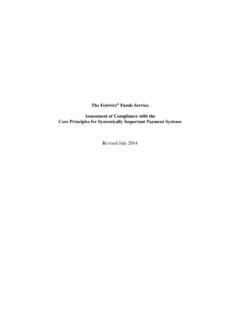
6 The data for the actual valuesof the variables are 3 of 17 For release at 2:00 , EST, December 15, 2021 Figure 2. FOMC participants assessments of appropriate monetary policy: Midpoint of target rangeor target level for the federal funds runPercentNote: Each shaded circle indicates the value (rounded to the nearest1/8percentage point) of an individualparticipant s judgment of the midpoint of the appropriate target range for the federal funds rate or the appropriatetarget level for the federal funds rate at the end of the specified calendar year or over the longer run. One participantdid not submit longer-run Projections for the federal funds 4 of 17 For release at 2:00 , EST, December 15, 2021 Figure Distribution of participants Projections for the change in real GDP, 2021 24 and over the longer range December projectionsSeptember projectionsNumber of rangeNumber of rangeNumber of rangeNumber of rangeNumber of participantsLonger runNote.
7 Definitions of variables and other explanations are in the notes to table 5 of 17 For release at 2:00 , EST, December 15, 2021 Figure Distribution of participants Projections for the unemployment rate, 2021 24 and over the longer range December projectionsSeptember projectionsNumber of rangeNumber of rangeNumber of rangeNumber of rangeNumber of participantsLonger runNote:Definitions of variables and other explanations are in the notes to table 6 of 17 For release at 2:00 , EST, December 15, 2021 Figure Distribution of participants Projections for PCE inflation, 2021 24 and over the longer range December projectionsSeptember projectionsNumber of rangeNumber of rangeNumber of rangeNumber of rangeNumber of participantsLonger runNote:Definitions of variables and other explanations are in the notes to table 7 of 17 For release at 2.
8 00 , EST, December 15, 2021 Figure Distribution of participants Projections for core PCE inflation, 2021 range December projectionsSeptember projectionsNumber of rangeNumber of rangeNumber of rangeNumber of participants2024 Note:Definitions of variables and other explanations are in the notes to table 8 of 17 For release at 2:00 , EST, December 15, 2021 Figure Distribution of participants judgments of the midpoint of the appropriate target range for thefederal funds rate or the appropriate target level for the federal funds rate, 2021 24 and over the longer range December projectionsSeptember projectionsNumber of rangeNumber of rangeNumber of rangeNumber of rangeNumber of participantsLonger runNote:Definitions of variables and other explanations are in the notes to table 9 of 17 For release at 2.
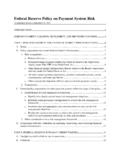
9 00 , EST, December 15, 2021 Figure Uncertainty and risks in Projections of GDP growthMedian projection and confidence interval based on historical forecast errors 3 2 1012345672016201720182019202020212022202 32024 Median of projections70% confidence intervalActualPercentChange in real GDPFOMC participants assessments of uncertainty and risks around their Economic projections24681012141618 LowerBroadlysimilarHigher December projectionsSeptember projectionsNumber of participantsUncertainty about GDP growth24681012141618 Weighted todownsideBroadlybalancedWeighted toupside December projectionsSeptember projectionsNumber of participantsRisks to GDP growthNote: The blue and red lines in the top panel show actual values and median projected values, respectively, ofthe percent change in real gross domestic product (GDP) from the fourth quarter of the previous year to the fourthquarter of the year indicated.
10 The confidence interval around the median projected values is assumed to be symmetricand is based on root mean squared errors of various private and government forecasts made over the previous 20years; more information about these data is available in table 2. Because current conditions may differ from thosethat prevailed, on average, over the previous 20 years, the width and shape of the confidence interval estimated onthe basis of the historical forecast errors may not reflect FOMC participants current assessments of the uncertaintyand risks around their Projections ; these current assessments are summarized in the lower panels. Generally speaking,participants who judge the uncertainty about their Projections as broadly similar to the average levels of the past20 years would view the width of the confidence interval shown in the historical fan chart as largely consistent withtheir assessments of the uncertainty about their Projections .