Transcription of Summary of Findings Tables for Joanna Briggs Institute ...
1 1 Summary of Findings Tables for Joanna Briggs Institute Systematic Reviews Orig inally develope d by the Joanna Brig gs Institute Levels of E v idence and Gra des o f Re com mendation Working Party* April 2014 Updated: January 20 16 2 Contents Introduction .. 3 Effectiveness Reviews .. 5 Qualitative and Text and Opinion 9 How to cite this document: .. 11 References .. 13 3 Introduction There has been a push internationally to adopt the approach of the GRADE (Grading of Recommendations Assessment, Development and Evaluation) working group1 who have developed a grading of evidence and recommendation system that has been endorsed by many evidence-based healthcare organizations, including Cochrane, WHO, AHRQ, NICE, BMJ Clinical Evidence and SIGN, amongst others.
2 The approach of GRADE is not to classify Findings based solely on study design but to consider other factors as well. The GRADE working group have developed a process to establish confidence in the synthesized results of quantitative research through considering issues related to risk of bias, publication bias, inconsistency, indirectness, imprecision of evidence, effect sizes, dose-response relationships, and confounders of The evidence is then ranked into one of four levels (High, Moderate, Low, Very Low). This process begins with Findings being assigned a pre-ranking based on their design (High = randomized controlled trials (RCTs), Low = observational studies), and then downgraded or upgraded based on the aforementioned factors.
3 A new, more nuanced ranking can then be assigned to an individual finding or outcome. In this way, evidence from observational studies can be ranked above that of RCTs where appropriate. This score is then applied to the major results of a quantitative systematic review. Key Findings and important supporting information is presented in a Summary of Findings table (or evidence profile) within the systematic review. These Summary of Findings Tables have been shown to improve understanding and accessibility of the results of systematic The Joanna Briggs Institute (JBI) and its collaborating entities have recently decided to adopt the GRADE approach for systematic reviews of effectiveness.
4 However, the JBI do not conduct reviews pertaining to effectiveness alone, and have developed methodology for conducting reviews of qualitative research and text and opinion. To date, there has been no widely accepted approach to assist health care professionals and policy makers in establishing confidence in the synthesized Findings of qualitative systematic reviews and to develop Summary of Findings for these types of reviews. To address this, a working party was established within the JBI to develop a system for establishing the confidence in the synthesized Findings of qualitative research and to present this in a Summary of Findings table.
5 4 This document outlines the methods for creating a Summary of Findings table for effectiveness, qualitative and text and opinion reviews. PLEASE NOTE: As of January 2016, all new JBI systematic reviews of effectiveness or qualitative evidence should include a Summary of Findings table. These should appear underneath the executive Summary in JBI systematic reviews in the appropriate format, following the implications for research. 5 Effectiveness Reviews Systematic reviews should be accompanied by a Summary of Findings The Summary of Findings table should include the question being investigated, the population, intervention and comparison, the outcomes assessed, estimated risk or odds for categorical data or weighted means for continuous data, relative effect, sample size as well as the number of studies which contributed to the sample, the GRADE quality of evidence for each finding.
6 And any comments (including decisions as to why the reviewers assigned the final GRADE ranking). These Summary of Findings Tables can be created using the web application GRADEPro GDT ( ) and should appear underneath the executive Summary in JBI systematic reviews in the appropriate format, following the implications for research. To determine a GRADE quality of the evidence, the GRADE approach begins by assigning Findings to one of two starting levels of quality depending on the study design. Initially, randomized trials are high quality, while observational studies are low quality.
7 Additionally, two other levels exist; moderate and very low. This gives four levels: High, Moderate, Low and Very low. Studies can then be up- or downgraded based on certain Factors that should lead to downgrading are: Risk of bias (as determined by the JBI MASTARI critical appraisal form; -1 if serious risk of bias, -2 if very serious risk of bias), Inconsistency or heterogeneity of evidence (-1 if serious inconsistency, -2 if very serious inconsistency), Indirectness of evidence (-1 if serious, -2 if very serious), Imprecision of results (-1 if wide confidence interval, -2 if very wide confidence interval) and Publication bias (-1 if likely, -2 if very likely).
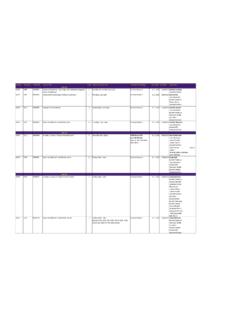
8 6, 7 8 9 Factors that should lead to upgrading are: Large magnitude of effect (+1 level if a large effect, +2 if a very large effect), Dose response (+1 level if there is evidence of a gradient), All plausible confounding factors would reduce the demonstrated effect (+1 level) or create a spurious effect where results suggest no effect (+1 level).6-9 Table 1: Summary of Findings Template 6 Summary of Findings : Very Tight glycemic control in both diabetic and nondiabetic patient compared to for Patient or population: Setting: Intervention: Very Tight glycemic control in both diabetic and nondiabetic patient Comparison.
9 Outcomes Anticipated absolute effects* (95% CI) Relative effect (95% CI) No of participants (studies) Quality of the evidence (GRADE) Risk with Risk with Very Tight glycemic control in both diabetic and nondiabetic patient All cause mortality (Mortality) assessed with: Number of death follow up: range 6-60 days to Study population OR ( to ) 1729 (5 RCTs) VERY LOW 1,2,3 52 per 1000 32 per 1000 (20 to 50) Length of stay in ICU(in days) The mean length of stay in ICU(in days) was 0 The mean length of stay in ICU(in days) in the intervention group was more ( fewer to more) - 590 (3 studies) VERY LOW 1,2,3 *The risk in the intervention group (and its 95% confidence interval) is based on the assumed risk in the comparison group and the relative effect of the intervention (and its 95% CI).
10 CI: Confidence interval; OR: Odds ratio; MD: Mean difference GRADE Working Group grades of evidence High quality: We are very confident that the true effect lies close to that of the estimate of the effect Moderate quality: We are moderately confident in the effect estimate: The true effect is likely to be close to the estimate of the effect, but there is a possibility that it is substantially different Low quality: Our confidence in the effect estimate is limited: The true effect may be substantially different from the estimate of the effect Very low quality.

