Transcription of SunSDR2 Pro Test Report - AB4OJ
1 1 SunSDR2 Pro Test Report By Adam Farson VA7OJ/ AB4OJ Iss. 1, september 18, 2015 . Figure 1: SunSDR2 Pro top front view. Introduction: This test Report presents results of an RF lab test suite performed on a SunSDR2 Pro direct-sampling/DUC SDR transceiver kindly loaned by Yuri Sushkin N3QQ. Hardware S/N: EED05231500077 Software/firmware versions: 1. Expert SDR2 (RX tests & all other TX tests ) 2. Expert SDR2 Beta 5 (TX tests 14 16, to correct low PEP issue) To ensure regulatory compliance, North American users must download and install Expert SDR2 Performance tests conducted in my home RF lab, August 27 september 9, 2015 . A. HF Receiver tests Note: Frequency calibration and level check ( MHz, -70 dBm) performed at start.
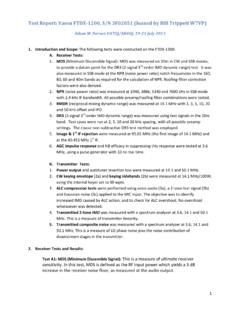
2 1: MDS (Minimum Discernible Signal) is a measure of ultimate receiver sensitivity. In this test, a signal generator is connected to ANT1 via a 20 dB pad. MDS is defined as the RF input power which yields a 3 dB increase in the receiver noise floor, as measured at the audio output. Test Conditions: CW, B = 500 Hz. ATT as shown, NR off, NB off, ANF off, AGC (RF) 100 dB, AGC slow. VHF LNA N/A. RX2 OFF throughout tests . Table 1: MDS in dBm. Pre Flt MHz MHz MHz MHz 0 0 -121 -119 -122 -120 1 0 -132 -129 -132 -132 0 1 -122 -123 -121 -122 1 1 -131 -133 -133 -132 Notes: 1. Pre = preamp, Flt = wideband filter on/preselector off. 2. VHF LNA is for 2m only; N/A on HF/6m.
3 3. Checking Auto Enable does not affect MDS. 2 2: Reciprocal Mixing Noise occurs in a direct-sampling SDR receiver when phase noise generated within the ADC mixes with strong signals close in frequency to the wanted signal, producing unwanted noise products at the IF and degrading the receiver sensitivity. Reciprocal mixing noise in a direct-sampler is an indicator of the ADC clock s spectral purity. In this test, a signal generator with low phase noise is connected via a 3 dB pad, a narrow bandstop filter and a 0-110 dB step attenuator to the DUT (ANT1). The noise floor is read on the DUT S-meter in CW mode (500 Hz) with ANT1 terminated in 50 . The signal generator is tuned for maximum null; next, the DUT is tuned to this frequency (f0).
4 The null should be at the noise floor. The bandstop filter reduces the signal source s close-in phase noise. The signal generator is now set to f0 - offset and output Pi increased to raise detected noise by 3 dB. Reciprocal mixing dynamic range (RMDR) = Pi MDS. Bandstop filter parameters: 4-pole crystal filter, centre freq. MHz, passband insertion loss dB, stopband attenuation > 80 dB, bandwidth at max. attenuation 300 Hz. Note: The residual phase noise of the measuring system is the limiting factor in measurement accuracy. Test Conditions: MHz, 500 Hz CW, ATT 0 dB, NR off, ANF off, NB off, negative offset. AGC (RF) 100 dB, Auto Enable on, default DSP settings.
5 RMDR in dB = input power (Pi) MDS (both in dBm). Here, MDS = -121 dBm at MHz. Table 2: RMDR in dB. Offset kHz Pi dBm RMDR dB 1 + 2 > + > 130 5 > + > 130 10 > + > 130 3: Channel filter shape factor (-6/-60 dB). This is the ratio of the -60 dB bandwidth to the -6 dB bandwidth, which is a figure of merit for the filter s adjacent-channel s rejection. The lower the shape factor, the tighter the filter. In this test, an approximate method is used. An RF test signal is applied at a power level approx. 60 dB above the level where the S-meter just drops from S1 to S0. The bandwidths at -6 and -60 dB relative to the input power are determined by tuning the signal generator across the passband and observing the S-meter.
6 Test Conditions: MHz, SSB/CW modes, ATT = 0 dB, AGC/RF 100 dB,AGC med, NR off, NB off, ANF off. Default filter config. (1537 taps). Table 3: Channel Filter Shape Factors. Filter Shape Factor -6 dB BW kHz -60 dB BW kHz kHz SSB 500 Hz CW 250 Hz CW Max. stopband attenuation > 85 dB. 3 4: NR noise reduction, measured as SINAD. This test is intended to measure noise reduction on SSB signals close to the noise level. A distortion test set or SINAD meter is connected to the DUT audio output. The test signal is offset 1 kHz from the receive frequency to produce a test tone, and RF input power is adjusted for a 6 dB SINAD reading (-122 dBm).
7 NR is then turned on, and SINAD read at various NR settings. Test Conditions: MHz, kHz USB, sampling rate 192K, BH-4 RX filter, buffer size 4096, AGC med, ATT = 0 dB, NB off, ANF off, NR/ANF Pre-AGC (in DSP Options), Dither off, Random off. Initial NR settings (defaults): Taps 40. Delay 45, Gain , Leak Table 4: NR SINAD. Taps Delay SINAD dB NR off 451 6 401 45 99 45 18 Note: 1. Default settings. This shows a SINAD improvement of 12 dB max. with NR at maximum for an SSB signal roughly 4 dB above the noise floor. This is an approximate measurement, as the amount of noise reduction is dependent on the original signal-to-noise ratio. In a brief on-air listening test, NR was very effective in reducing band noise (as long as the desired signal was audible), and did not distort received audio.
8 5: Auto-Notch Filter (ANF) stopband attenuation. In this test, an RF signal is applied at a level 70 dB above MDS. The test signal is offset 1 kHz from the receive frequency to produce a test tone. ANF is activated and the test signal level is adjusted to raise the baseband level 3 dB above noise floor. The stopband attenuation is equal to the difference between test signal power and MDS. Test Conditions: MHz, kHz USB, AGC (RF) 100 dB, AGC med, ATT = 0 dB, NB off, ANF off. Initial NR settings (defaults): Taps 60, Delay 64, Gain , Leak Test results : Measured MDS = -110 dBm (B = kHz). Stopband attenuation = test signal power - MDS = -21- (-110) = 89 dB.
9 6: AGC impulse response. The purpose of this test is to determine the SunSDR2 Pro's AGC response in the presence of fast-rising impulsive RF events. Pulse trains with short rise times are applied to the receiver input. Test Conditions: MHz, kHz LSB NR off/on as required, NB off/NB1/NB2 as required, ANF off, ATT= 0 dB, AGC (RF) 100 dB,AGC fast, ANF off. Scope settings: AVG 5, Refresh 5 ms. A pulse generator is connected to ANT1 via a step attenuator. The pulse rise time (to 70% of peak amplitude) is 10 ns. Pulse duration t is varied from to 95 ns. In all cases, pulse period is 600 ms. The step attenuator is set at 36 dB. Pulse amplitude is 16 Vpk ( ) 4 AGC ticks are audible from t = 10 ns up.
10 For t > 100 ns, the ticks do not become louder. With NR on and t 100 ns, NR reduces the ticks to quiet holes in the receiver audio. ANF has no effect on the ticks. NR reduces the white noise level with NB1 or NB2 on. With the above scope settings, the scope baseline bounces +12 dB with each pulse. The pulse train creates clearly visible waterfall bars . NB1 suppresses the ticks, scope bounce and waterfall bars entirely. NB2 reduces tick amplitude and waterfall density but does not kill these effects entirely as does NB1. The S-meter barely deflects during the test. Figures 2, 3 & 4 are waterfall screen images for NB off, NB1 and NB2. Figure 2: AGC impulse response, NB off.