Transcription of Systems Analysis and Control
1 Systems Analysis and ControlMatthew M. PeetArizona State UniversityLecture 21: Stability Margins and Closing the LoopOverviewIn this Lecture, you will learn:Closing the Loop Effect on Bode Plot Effect on StabilityStability Effects Gain Margin Phase Margin BandwidthEstimating Closed-Loop Performance using Open-Loop Data Damping Ratio Settling Time Rise TimeM. PeetLecture 21: Control Systems2 / 31 ReviewRecall: Frequency ResponseInput:u(t) =Msin( t+ )Output:Magnitude and Phase Shifty(t) =|G( )|Msin( t+ + G( ))02468101214161820 2 1 Simulation ResultsTime (sec)AmplitudeFrequency Response tosin tis given byG( )M. PeetLecture 21: Control Systems3 / 31 ReviewRecall: Bode PlotDefinition Bode Plotis a pair oflog-logand semi-logplots:1. Magnitude Plot:20 log10|G( )| 2. Phase Plot: G( ) Bite-Size Chucks: G( )= i Gi( )M. PeetLecture 21: Control Systems4 / 31 Complex Poles and ZerosWe left off withComplex Poles:G(s) =1((s n)2+ 2 s n+ 1)M.
2 PeetLecture 21: Control Systems5 / 31 Closing The LoopNow we examine the effect of closing the loop on the Frequency simple Unity Feedback (K= 1).Closed-Loop Transfer Function:Gcl( ) =G( )1 +G( )We are most concerned with magnitude:|Gcl( )|=|G( )||1 +G( )|G(s)k+-y(s)u(s)Figure : Unity FeedbackM. PeetLecture 21: Control Systems6 / 31 Closing The LoopOn the Bode Plot20 log|Gcl( )|= 20 log|G( )| 20 log|1 +G( )|Which is the combination of The original bode plot The new factorlog|1 +G( )|We are most concerned with the effectof the new term 20 log|1 +G( )|Specifically, as1 +G( ) 0lim1+G( ) 0 20 log|1 +G( )|= An unstable mode! 80 70 60 50 40 30 20 1001020 Magnitude (dB)10 1100101102 180 135 90 450 Phase (deg)Bode DiagramFrequency (rad/sec)Figure : Open Loop: Blue, CL: GreenM. PeetLecture 21: Control Systems7 / 31 Closing The LoopStability MarginInstability occurs when1 +G( ) = 0 For this to happen, we need: |G( )|= 1 G( ) = 180 Stability Marginsmeasure how far weare from the point(|G|= 1, G= 180 ).
3 Definition Crossover Frequency, gcis the frequency at which|G( c)|= is the danger point: If G( c) = 180 , we are unstableM. PeetLecture 21: Control Systems8 / 31 Closing The LoopPhase MarginDefinition Margin, Mis the phase relative to180 when|G|= 1. M=|180 G(i gc)| gcis also known as the phase-margin frequency, MM. PeetLecture 21: Control Systems9 / 31 Closing The LoopGain MarginDefinition Crossover Frequency, pcis the frequency (frequencies) at which G( pc) = 180 .Definition Margin,GMis the gainrelative to0dBwhen G= 180 . GM= 20 log|G( pc)|GMis the gain (in dB) which willdestabilize the system in closed loop. pcis also known as the gain-margin frequency, GMM. PeetLecture 21: Control Systems10 / 31 Closing The LoopStability MarginsGain and Phase Margin tell how stable the system would be in Closed quantities can be read from theOpen-Loop PeetLecture 21: Control Systems11 / 31 Closing The LoopStability Margins: Suspension system 80 70 60 50 40 30 20 1001020 Magnitude (dB)10 1100101102 180 135 90 450 Phase (deg)Bode DiagramGm = Inf dB (at Inf rad/sec) , Pm = deg (at rad/sec)Frequency (rad/sec)M.
4 PeetLecture 21: Control Systems12 / 31 Closing The LoopStability Margins M= 35 GM= 10dBM. PeetLecture 21: Control Systems13 / 31 Closing The LoopStability MarginsNote that sometimes the margins are undefined When there is no crossover at0dB When there is no crossover at180 M. PeetLecture 21: Control Systems14 / 31 Transient ResponseClosing the LoopQuestion:What happens when we Close the Loop? We wantPerformance Specs! We only have open-loop data. MandGMcan help Feedback:G(s)k+-y(s)u(s)We want: Damping Ratio Settling Time Peak ResponseTime (sec)AmplitudeM. PeetLecture 21: Control Systems15 / 31 Transient ResponseQuadratic ApproximationAssume the closed loop system is the quadraticGcl= 2ns2+ 2 ns+ 2nThen the open-loop system must beGol= 2ns2+ 2 nsAssumethat our open-loop system isGol Use Mto solve for Set20 log|Gcl|= 3dBto solve for nM. PeetLecture 21: Control Systems16 / 31 Transient ResponseDamping RatioThe Quadratic Approximation gives theClosed-Loop Damping Ratioas M= tan 12 2 2+ 4 4+ 1 Mis from theOpen-Loop Data!
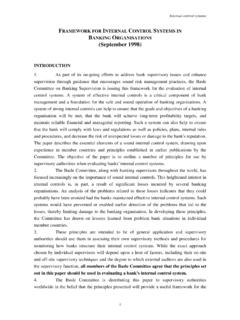
5 A Handy approximation is = M100 Only valid out to =.7. Given M, we find closed-loop .M. PeetLecture 21: Control Systems17 / 31 Transient ResponseBandwidth and Natural FrequencyWe find closed-loop from Phasemargin. We can find closed-loop NaturalFrequency nfrom the , BWis the frequencyat gain20 log|G( BW) =|20 log|G(0)| 3dB. Closely related to crossover frequency. The Bandwidth measures the range of frequencies in the output. For 2nd order, Bandwidth is related to natural frequency by BW= n (1 2 2) + 4 4 4 2+ 2M. PeetLecture 21: Control Systems18 / 31 Transient ResponseFinding Closed-Loop Bandwidth from Open-Loop DataQuestion:How to find closed-loop bandwidth?Finding the closed-loop bandwidth from open-loop data is to find the frequency when the Bode plot intersects this curve. Heuristic:Check the frequency at 6dB and see if phase is =180 .M. PeetLecture 21: Control Systems19 / 31 Finding Closed-Loop Bandwidth from Open-Loop DataExample 80 70 60 50 40 30 20 1001020 Magnitude (dB)10 1100101102 180 135 90 450 Phase (deg)Bode DiagramFrequency (rad/sec)At phase135 , 5dB, we get closed loop BW = PeetLecture 21: Control Systems20 / 31 Transient ResponseBandwidth and Settling TimeWe can use the expressionTs=4 nto get BW=4Ts (1 2 2) + 4 4 4 2+ 2 Given closed-loop and BW, we can PeetLecture 21: Control Systems21 / 31 Transient ResponseBandwidth and Peak TimeWe can use the expressionTp= n 1 2to get BW= Tp 1 2 (1 2 2) + 4 4 4 2+ 2 Given closed-loop and BW, we can PeetLecture 21: Control Systems22 / 31 Transient ResponseBandwidth and Rise TimeUsing an expression forTr, we get a relationship between BW Trand.
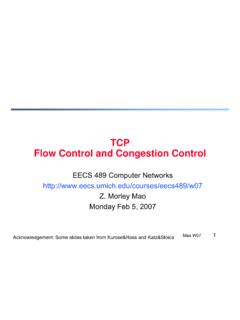
6 Given closed-loop and BW, we can PeetLecture 21: Control Systems23 / 31 Transient ResponseExampleQuestion:Using Frequency Response Data, findTr,Ts,Tpafter Step:Find the phase Margin. Frequency at0dB is gc =2 G(2) = 145 M= 180 145 = 35 M. PeetLecture 21: Control Systems24 / 31 Transient ResponseExampleStep 2:Closed-Loop Damping Ratio = M100=.35 Step 3:Closed-Loop Bandwidth Intersect at =(|G|= 6dB, G= 170 ) Frequency at intersection is BW = PeetLecture 21: Control Systems25 / 31 Transient ResponseExampleStep 4:Settling Time and Peak Time BW= , =.35 BWTs= 20impliesTs= BWTp= PeetLecture 21: Control Systems26 / 31 Transient ResponseExampleStep 5:Rise Time BW= , =.35 BWTr= PeetLecture 21: Control Systems27 / 31 Transient ResponseExampleStep 6:Experimental the plantG(s) =50s(s+ 3)(s+ 6)We find Tp= Tr=. Ts= : Step ResponseM. PeetLecture 21: Control Systems28 / 31 Steady-State ErrorFinally, we want steady-state error.
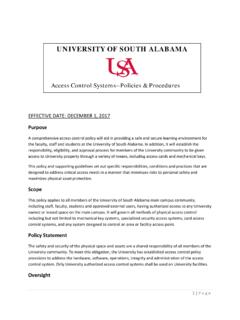
7 Steady-State Step response islims 0G(s) = lim 0G( )Steady-state response is the Low-Frequency Gain,|G(0)|.Close The Loopto get steady-state erroress=11 +|G(0)|M. PeetLecture 21: Control Systems29 / 31 Steady-State ErrorExampleA Lag Compensatorlim 020 logG( ) = 20dBSolim 0|G( )|= Error:ess=11 +G(0)=111=.091 20 10010203040 Magnitude (dB)100101102103104105 90 450 Phase (deg)Bode DiagramFrequency (rad/sec)M. PeetLecture 21: Control Systems30 / 31 SummaryWhat have we learned today?Closing the Loop Effect on Bode Plot Effect on StabilityStability Effects Gain Margin Phase Margin BandwidthEstimating Closed-Loop Performance using Open-Loop Data Damping Ratio Settling Time Rise TimeNext Lecture: Compensation in the Frequency DomainM. PeetLecture 21: Control Systems31 / 31