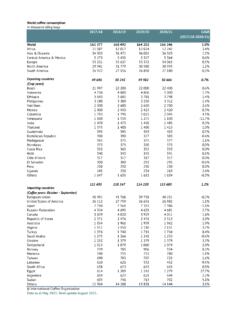
Transcription of Table 1: Crop year production by country* In thousand 60 ...
1 Table 1: Crop year production by country* In thousand 60-kg bagsCrop year commencing2017201820192020% change2019-20 TOTAL163 693172 461164 953175 682102 69292 585105 Milds15 09915 52515 51815 Milds31 69131 81429 21929 Naturals48 89255 35447 84860 01169 76872 36870 35418 62018 68618 te d'Ivoire1 6242 1751 9291 Republic of 3477 5117 3437 5974 7045 5095 & Oceania52 44347 75349 33649 8135 3254 9885 8529 61811 43312 People's Democratic New 43230 28330 48729 & Central America21 74421
2 64119 56419 Rica1 5611 4271 4721 7344 0073 6063 5607 1535 9316 4854 3513 9854 6422 8792 8822 America72 15284 44777 36788 74065 13158 21169 82413 86614 10014 2794 2633 8363 *As the figures in this Table are on a crop year basis, these estimates will vary from the figures published in Table 2 of this report and Table 3of the Coffee Market Report. For further details, see the explanatory note at the end of this may not add up due to rounding. International Coffee OrganizationData as at May 2021 - next update August 2021 Table 2.
3 Coffee year production by countryIn thousand 60-kg bagsCoffee year commencing2017201820192020% change2019-20 TOTAL167 868170 322168 833169 18799 91996 93099 Milds15 14815 49415 51515 Milds31 79331 63929 22829 Naturals51 24752 78552 18754 68070 40371 90370 46118 57918 68118 te d'Ivoire1 6242 1751 9291 Republic of 3477 5117 3437 5974 7045 5095 & Oceania52 20348 17349 47848 8135 3254 9885 54410 07111 60011 People's Democratic New 43230 28330 48729 & Central America21 75221 63619 55719 Rica1 5611 4271 4721 7344 0073 6063 5607 1535 9316 4854 3513 9854 6422 8792 8822 America76 45381 93481 11882 07762 70961 98763 82413 86614 10014 2754 1573 8273 may not add up due to rounding.
4 International Coffee OrganizationData as at May 2021 - next update August 2021 Explanatory Note for the Coffee production Report For each year, the Secretariat uses statistics received from Members to provide estimates and forecasts for annual production , consumption, trade and stocks. As noted in paragraph 100 of document ICC 120-16, these statistics can be supplemented and complemented by data from other sources when information received from Members is incomplete, delayed or inconsistent.
5 The Secretariat also considers multiple sources for generating supply and demand balance sheets for non-Members. The Secretariat uses the concept of the marketing year, that is the coffee year commencing on 1 October of each year, when looking at the global supply and demand balance. Coffee-producing countries are located in different regions around the world, with various crop years, the 12-month period from one harvest to the next. The crop years currently used by the Secretariat commence on 1 April, 1 July and 1 October.
6 To maintain consistency, the Secretariat converts production data from a crop year basis to a marketing year basis depending on the harvest months for each country. Using a coffee year basis for the global coffee supply and demand, as well as prices ensures that analysis of the market situation occurs within the same time period. For example, the 2014/15 coffee year began on 1 October 2014 and ended 30 september 2015. However, for producers with crop years commencing on 1 April, the crop year production occurs across two coffee years.
7 Brazil s 2014/15 crop year began on 1 April 2014 and finished 31 March 2015, covering the first half of coffee year 2014/15. However, Brazil s 2015/16 crop year commenced 1 April 2015 and ended 31 March 2016, covering the latter half of coffee year 2014/15. In order to bring the crop year production into a single coffee year, the Secretariat would allocate a portion of the April-March 2014/15 crop year production and a portion of the April-March 2015/16 production into 2014/15 coffee year production .
8 It should be noted that while estimates for coffee year production are created for each individual country, these are made for the purpose of creating a consistent aggregated supply-demand balance for analytical purposes, and does not represent the production occurring on the ground within the individual countries.