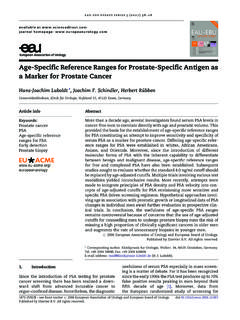
Transcription of Table 1. Insulin Reference Ranges in uIU/mL of Six ...
1 Table 1. Insulin Reference Ranges in uIU/mL of Six laboratories in New york metropolitan Area* Laboratory Fasting 1 Hr 2 Hr 3 Hr Laboratory 1 - 23 8 - 112 5 35 Not Reported Laboratory 2 - - - Not Reported Laboratory 3 - 8 - 112 5 - 55 3 - 20 Laboratory 4 6 - 27 20 - 120 18 - 56 8 - 22 Laboratory 5 00 - 30 30 - 200 40 - 300 50 - 150 Laboratory 6 Does not include Insulin Ranges in the report. Instead it includes the following note: Insulin analogues may demonstrate non-linear cross-reactivity in this essay.
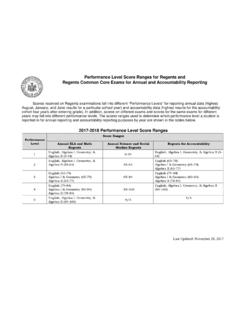
2 Interpret results accordingly.** *Upper and lower limits of laboratory Reference Ranges for blood Insulin concentration determined following a Standard 75-gram glucose challenge. **Personal communications with clinicians revealed that they do not find this laboratory note to be satisfactory in their clinical decision-making. Table 2. Insulin Homeostasis Categories in 506 Study Subjects Without Type 2 Diabetes Percentage of Mean Peak Glucose Mean Peak Insulin Insulin Category* Subgroup mg/dL (mmol/mL) ( uIU/mL ) Exceptional Insulin Homeostasis N = 12** ( ) Optimal Insulin Homeostasis N = 126 % ( ) Hyperinsulinism, Mild N = 197 % ( ) Hyperinsulinism, Moderate N = 134 % ( ) Hyperinsulinism, Severe N = 49 % ( )
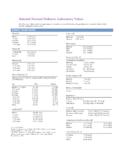
3 # Correlation coefficient, r value, for means of peak glucose and Insulin levels in the five Insulin categories is *Criteria for classification: (1) Exceptional Insulin homeostasis, a subgroup of optimal Insulin homeostasis with fasting Insulin concentration of <2 uIU/mL and mean peak Insulin concentration of <20; (2) optimal Insulin homeostasis, peak Insulin <40 accompanied by unimpaired glucose tolerance; (3) mild. ** The exceptional Insulin homeostasis is a subgroup of optimal Insulin homeostasis group. Table 3. Insulin Homeostasis Categories in 178 Study Subjects with Type 2 Diabetes Percentage of Mean Peak Glucose Mean Peak Insulin Insulin Category Subgroup mg/dL (mmol/mL) ( uIU/mL ) Diabetic Hyperinsulinism, Mild N = 53 ( ) Diabetic Hyperinsulinism, Moderate N = 42 ( ) Diabetic Hyperinsulinism, Severe N = 24 ( ) Diabetic Insulin Deficit N = 59 ( ) Table 4.
4 Example of Insulin and Glucose Profiles in Exceptional Insulin Homeostasis Category* Fasting Hr 1 Hr 2 Hr 3 Hr Insulin uIU/mL <2 18 14 4 <2 Glucose mg/mL (mmol/L) 77 ( ) 168 ( ) 109 ( ) 74 ( ) 59 ( ) *The patient, a 60-yr-old 5 7 man weighing 138 lbs. presented for a wellness assessment. He was in excellent health by clinical and laboratory evaluation criteria.