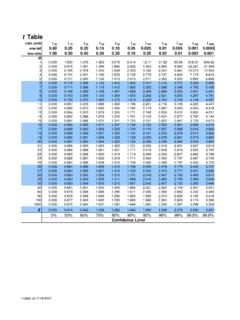
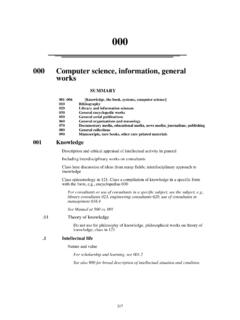
Transcription of Table 4 Binomial Probability Distribution
1 Table 4 Binomial Probability Distribution Crn, qprnr This Table shows the Probability of r successes in n independent trials, each with Probability of success ; 4 4 4 5 Areas of a Standard Normal DistributionThe Table entries represent the area under the standardnormal curve from 0 to the specified value of values of z greater than or equal to , use to approximate the shaded area under the standard normal 6 Student s t DistributionStudent s t values generated by Minitab Version is a confidence is the level of significance for a one-tailed is the level of significance for a two-tailed of a Standard Normal DistributionThe Table entries represent the area under the standard normal curve from 0 to thespecified value of values of z greater than or equal to , use to approximate the shaded area under the standard normal Levels of Confidence and Their CorrespondingCritical ValuesCommonly Used Critical Values z0 from the StandardNormal DistributionLevel of Confidence cCritical Value zcType of TestLevel of 8 Critical Values of Pearson Product-Moment Correlation Coefficient, ra = = tailtwo tailsone tailtwo a right-tailed test, use a positive r a left-tailed test, use a negative r a two-tailed test, use a positive r negative r Used Formulasn = sample sizeN = population sizef = frequencyChapter 1 Class Width = classes of numberlowhigh (increase to nextinteger)Class Midpoint = 2lowerlimit upperlimit+Lower boundary = lower boundary of previous class +class widthChapter 2 Sample mean X= nx Population mean = Nx Range = largest data value - smallest data valueSample standard deviations s = 1n2)x(x Computation formula s = 1nxSS where ()
2 =n2x2xxSSPopulation standard deviation ()Nx =2 Sample variance 2sPopulation variance 2oSample Coefficient of Variation 100 =xsCVSample mean for grouped data nxfx =Sample standard deviation for grouped data ()12 =nfxxsChapter 3 Regression and CorrelationIn all these formulas() =n2x2xxSS() =n22yySSy()() =nyxxyxySSLeast squares line bxay+=wherexSSxySSb= and xbya =Pearson product-moment correlation coefficient ySSxSSxySSr=Coefficient of determination 2r=Chapter 4 Probability of the complement of event A () ()APAnotP =1 Multiplication rule for independent events ()()()BPAPBandAP =General multiplication rules ()()( )AgivenBPAPBandAP, = ()()( )BgivenAPBPBandAP, =Addition rule for mutually exclusive events ()()()BPAPBorAP+=General addition rule ()()()( )BandAPBPAPBorAP +=Permutation rule ()!rnn!rn,P =Combination rule ()!rnr!n!rn,C =Chapter 5 Mean of a discrete Probability Distribution () =xxP Standard deviation of a discrete Probability Distribution ()() =xP2 x For Binomial Distributionsr = number of successes; p = Probability of success; p1q = Binomial Probability Distribution rnqrpr)!
3 (nr!n!P(r) =Mean np= Standard deviation npq= Chapter 6 Raw score z x+=Standard score xz =Chapter 7 Mean of xdistribution x=Standard deviation of x Distribution n x=Standard score for x n xz =Chapter 8 Confidence Intervalfor ()30nwhen n zx n zxcc+<< for ()30nwhen < = nstx nstxcc+<< for ()5nqand5npwhenp>> ()()np 1p zp pnp 1p zp cc +<< where r/np =Sample Size for Estimatingmeans 2E znc =proportions()2 Ezp1pnc =with preliminary estimate for p2Ez41nc = without preliminary estimate for pChapter 9 Sample Test Statistics for Tests of Hypothesesfor ()30nwhen n xz =for ()30nwhen <; xt = =for p npqpp z = where p1q =Chapter 10 Sample Test Statistics for Tests of Hypothesisfor paired difference d 1 = = difference of means large sample ()()n n xxz2221212121= =difference of proportions nq p nq p p p z2121+ =where ;p q ;nnrrp =++=12121 nrp ;nrp 222111==Confidence Intervalsfor difference of means (when 303021 nandn) ()()xxnnzxx2121222221221 < <+ nnz2221212 ++for difference of proportions where p q p q nrp rp ;;22112221111 = === ()()p p p p nq p nq p zp p 2121222111221 < <+ nq p nq p zc222111++Chapter 11() =EEOx22 where()()sizesampletotalcolumntotalrowE= Tests of independence ()() =CRfdGoodness of fit () =entriesofnumberfdSample test statistic for 120 == ;k:H () 2221snx =Linear RegressionStandard error or estimate 2 =nbSSSSS xyye where SSSS byxy=Confidence interval for y EyEypp+< where ypis the predicted y value for x and ()SSxxnStExec211 ++= with =nf)