Transcription of Table of Content - Japanese Nursing Association
1 1. Japanese Society 2 Socioeconomic situation Transition of population Health situation and trend 2. Japanese Healthcare System 4 Health insurance system and medical fee Healthcare provision system Long-term care insurance system Reforms in health and long-term care services3. Overview of Japanese Nursing System 7 History and system Public health nurses Midwives Nurses4. Nursing Education in japan 10 Basic Nursing education Contents of education Development of university Nursing education Clinical training for newly-graduated Nursing personnel Continuing education Credentialing system Training system for nurses to perform specific medical interventions5.
2 Working Conditions in Nursing in japan 14 Employment status of Nursing personnel Improvement of work environmentReferences 16 Table of ContentNursing in japan 201601 japan is an advanced developed country, as shown by its G7/G20 membership. However, japan s economy has been stagnant since the economic bubble burst in the beginning of 1990 s. In recent years, the population decrease and population aging is progressing simultaneously. The employment pattern in japan has been changed. This raises the proportion of non-regular employment workers with the issues of unstable employment and low wages. In 2013, non-regular employment workers accounted for of all the employed workers excluding executives1).
3 The increased number of elderly household and unemployment caused by socio-economic situation resulted in the upward trend of public assistant recipients and the challenge of poverty2).Socioeconomic situationTransition of populationHealth situation and trend japan s population is million as of January 1, 20153), accounting for approximately ) of the world s the birthrate declined around the end of World War II, japan s population showed an increase, experiencing two baby booms in 1947-49 and 1971-74. However, the population decrease was seen in 2005 for the first time after WW II and it showed increase and decrease thereafter.
4 Since 2010, the population is on the declining around 1970, the elderly population has been increasing dramatically. The proportion of the population aged 65-year or over to the total population was in 20153) and will reach in 20605). In contrast, the proportion of the population under 15 will decline from in 20153) to in 20605). This means one in people will be an elderly s health situation has continuously improved in all health-related indicators, such as the average life expectancy of men is and that of women ), while the infant mortality rate is ) as of healthy life expectancy of men is and that of women as of 2013, which indicates the length of life without activity limitation caused by health problems.
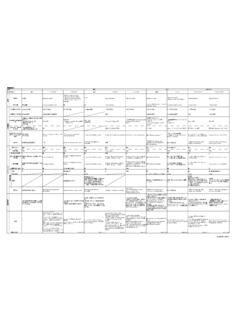
5 Although the healthy life Nursing in japan 2016021. Japanese SocietyFigure 1: Population pyramid3) (as of January 2, 2015)(10,000 persons)085 8980 8475 7970 7465 6960 6455 5950 5440 4445 4935 3930 3425 2920 2415 1910 145 90 42004006001003005000100300500200400600(A ge)MenWomenover 10095 9990 94 Figure 4: Transition of infant mortality rates and total fertility rates7) 1950 556065707580859095 2000 0510 13 (Year)(per 1,000 births) fertility rateTotal fertility rateInfant mortality rateInfant mortality 3: Transition of fertility and mortality rates7) (Year)195055606570758085909520001005(pop ulation per 1,000) rateMortality 2: Vital statistics overview9)Live births1,029,8161 in every 31 secondsDeaths1,268,4361 in every 25 secondsInfant deaths(included inDeaths) 2,1851 in every secondsFetal deaths24,1021 in every21 min.
6 48 seconds(2013)expectancy is extending, the gap between healthy life expectancy and life expectancy are approximately 9-year for men and 12-year for women8). As aging progresses, the measures to prolong the healthy life expectancy are taken which will lead the advancement of quality of people s life and reduction of the burden of social security the birth trend in japan , the birthrate (per 1,000 population) hovered in the 30s from the Meiji period (1868) through the beginning of the Showa period (1920s). Immediately after World War II, an increase in marriages triggered the first baby boom with high birthrates.
7 However, after its peak in 1950, the birthrate declined rapidly. Those who were born during the first baby boom reached their childrearing age, showing a temporary increase in the birthrate during the second baby boom in 1971-74. Since then, however, the birthrate has remained at a low level with some )The total fertility rate was in the 1950s, but declined to in 2013. This has many possible causes. In addition to lower neonatal and infant mortality rates due to advancement in health care, the decline in the 80s can be attributed to the trend toward delayed marriage and increase in unmarried people and in the 90s can be attributed to a change in the number of children per couple.
8 The average age of mothers giving birth to their first child was in 1965 and 1975, and risen to in ) Although the mortality rate (crude deaths per 1,000 population) in japan had hovered at the 20s around the Meiji period (1868-1912), it declined to 16 in 1941. After the War, the rate showed a continuous downward trend, reaching the lowest point of in 1982. However, this rate has been showing an upward trend with the aging population and was in ) The primary cause of death was pneumonia througuout the Meiji period, then it changed to tuberculosis (TB). From the latter 1950s deaths from TB greatly decreased and the causes of death in japan shifted significantly from communicable diseases to non-communicable diseases.
9 Since 1958, malignant neoplasms, heart disease and cerebral vascular disease have formed the three major causes of death, and currently account for approximately 60% of all deaths. Under these circumstances, measures to prevent non-communicable diseases are stressed. Amid the ongoing population aging, efforts are taken to prolong the healthy life expectancy so that people can live their life longer without activity the number of deaths due to communicable diseases has been reduced, there are still some issues like HIV/AIDS, TB and prevalence rate of TB (per 100,000 population) reached below the 20s level in 2007 for the first time, and was in ) Although it shows a continuous downward trend, japan is a country with a medium tuberculosis epidemic in the world.
10 Among the patients with persistent viral hepatitis, million are estimated to have type B and million to have type C11). It has become an issue since the time of infection can hardly be identified and the infection is often asymptomatic, patients who have not received treatment at an appropriate time can easily develop cirrhosis or liver cancer. In addition, the number of people with mental problems has also been increasing due to the stress of severe work environments, including overwork, in modern Japanese the in- and outpatient rates (per 100,000 population), the survey in 2011 showed that persons aged 65 or older accounted for over 68% of inpatients and 46% of outpatients12).