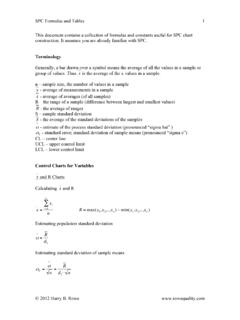
Transcription of Tables of Constants for Control charts
1 Ref : AIAG manual for SPCC hart for AveragesChart for AveragesControl Limits FactorDivisors to Estimate xControl Limits FactorDivisors to estimate xSubgroup size (n) LimitsX bar and R ChartsX bar and s ChartsTables of Constants for Control chartsFactors for Control LimitsX bar and R ChartsX bar and s chartsChart for Ranges (R) chart for Standard Deviation (s)Table 8A - Variable DataFactors for Control LimitsXCLX=RCLR=XCLX=sCLs=RAXUCLX2+=RAXL CLX2 =RDUCLR4=RDLCLR3=SAXUCLX3+=SAXLCLX3 =sBLCLs3=sBUCLs4=x 2dR4csInstitute of Quality and chart FactorsPage 1 of 3ref : AIAG manual for SPCC hart for MediansChart for IndividualsControl Limits FactorDivisors to Estimate xControl Limits FactorDivisors to Estimate xSubgroup for IndividualsMedian ChartsControl LimitsCenterlineTables of Constants for Control chartsFactors for Control LimitsFactors for Control LimitsTable 8B Variable DataChart for Ranges (R) chart for Moving Range (R)Median ChartsCharts for IndividualsXCLX~~=RCLR=XCLX=RAXUCLX2~~~+ =RAXLCLX2~~ =RDUCLR4=RDLCLR3=REXUCLX2+=REXLCLX2 =RCLR=RDUCLR4=RDLCLR3=2~AInstitute of Quality and chart FactorsPage 2 of 3 Table 8 C Attribute Dataref.
2 AIAG manual for SPCC enterlinenp chart for number / rate of units in a categoryc chart for number of incidences in one or more categoriesSamples not necessarily of constant sizeusing average sample sizeIf the sample size is constant (n) Tables of Formulas for Control chartsControl LimitsSamples not necessarily of constant sizeu chart for number of incidences per unit in one or more categoriesIf the Sample size is constant (n)p chart for proportions of units in a categorypCLp=pnCLnp=cCLc=uCLu=ipnpppUCLi )1(3 +=ipnpppLCLi)1(3 =npppLCLp)1(3 =npppUCLp)1(3 +=ccUCLc3+=ccLCLc3 =iunuuUCL3+=iunuuLCL3 =nuuUCLu3+=nuuUCLu3 =nuuUCLu3+=nuuUCLu3 =)1(3ppnpnUCLnp +=)1(3ppnpnLCLnp =Institute of Quality and chart Factors Page 3 of 3