Transcription of Test 2A AP Statistics Name - d2ct263enury6r.cloudfront.net
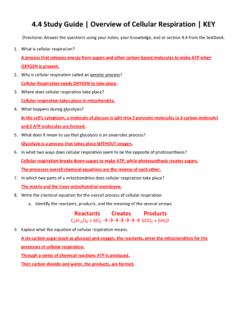
1 Test 2A AP Statistics name : Directions: Work on these sheets. A standard Normal table is attached. Part 1: Multiple Choice. Circle the letter corresponding to the best answer. 1. The heights of American men aged 18 to 24 are approximately Normally distributed with mean 68. inches and standard deviation inches. Half of all young men are shorter than (a) inches (b) 68 inches (c) inches (d) can't tell, because the median height is not given (e) none of the above 2. Use the information in the previous problem. Only about 5% of young men have heights outside the range (a) inches to inches (b) 63 inches to 73 inches (c) inches to inches (d) 58 inches to 78 inches (e) none of the above 3. For the density curve shown to the right, which statement is true?
2 (a) The area under the curve between 0 and 1 is 1. (b) The density curve is symmetric. (c) The density curve is skewed right. (d) The density curve is Normal. (e) None of the above is correct. 4. For the density curve shown in Question 3, which statement is true? (a) The mean and median are equal. (b) The mean is greater than the median. (c) The mean is less than the median. (d) The mean could be either greater than or less than the median. (e) None of the above is correct. 5. The area under the standard Normal curve corresponding to < Z < is (a) (b) (c) (d) (e) none of the above Chapter 2 1 Test 2A. 6. A Normal density curve has which of the following properties? (a) It is symmetric.
3 (b) It has a peak centered above its mean. (c) The spread of the curve is proportional to it standard deviation. (d) All of the properties (a) to (c) are correct. (e) None of the properties (a) to (c) is correct. 7. Many professional schools require applicants to take a standardized test. Suppose that 1000. students take the test, and you find that your mark of 63 (out of 100) is the 73rd percentile. This means that (a) at least 73% of the people scored 63 or better. (b) at least 270 people scored 73 or better. (c) at least 730 people scored 73 or better. (d) at least 27% of the people scored 73 or worse. (e) at least 270 people scored 63 or better. 8. The yield of a variety of wheat was measured on a series of small plots and was found to be approximately Normal.
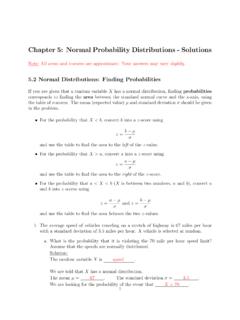
4 The 2nd and 98th percentile were found to be 29 bushels/acre and 41. bushels/acre respectively. The standard deviation (bushels/acre) is approximately (a) 12 (b) 6 (c) 4 (d) 3 (e) 2. 9. Which of the following histograms would be best approximated by a Normal distribution? (a) (b) (c). (d) (e) All of (a) through (d). Chapter 2 2 Test 2A. Part 2: Free Response Answer completely, but be concise. Show your thought process clearly. 10. We all know that the body temperature of a healthy person is F. In reality, the actual body temperature of individuals varies. Here are boxplots, produced by Minitab, for the body temperatures of 130 individuals (65 males and 65 females). Gender 1. 2 * * *.
5 Temps (a) What do the boxplots suggest about the Normality of the distributions of temperatures for males (Gender = 1) and females (Gender = 2)? Give specific evidence to justify your answer. (b) Here's a Normal probability plot of the temperatures of the males. Explain how it justifies assuming that the population distribution of male temperatures is Normally distributed. (c) According to Minitab, = and = for the male temperatures. If we assume that the males' temperatures are Normally distributed, what percent would have temperatures at degrees or above? Show your work. Chapter 2 3 Test 2A. 11. The best male long jumpers for State College since 1973 have jumped an average of inches with a standard deviation of inches.
6 The best female long jumpers have averaged inches with a standard deviation of inches. This year Joey jumped 275 inches and his sister, Carla, jumped 207 inches. Both are State College students. (a) Find the standardized values for Joey's and Carla's jumps. Which athlete had the more impressive performance? Explain briefly. (b) Assume that male and female jumps are Normally distributed. Find the percentiles for Joey's and Carla's jumps. Interpret these percentiles in context. 12. The length of pregnancies from conception to natural birth among a certain female population is Normally distributed with mean 270 days and standard deviation 10 days. (a) According to the 68 95 rule, what percent of pregnancies last more than 300 days?
7 Show your method. (b) How short must a pregnancy be in order to fall in the shortest 10% of all pregnancies? Show your method. I pledge that I have neither given nor received aid on this Chapter 2 4 Test 2A. Test 2B AP Statistics name : Directions: Work on these sheets. A standard Normal table is attached. Part 1: Multiple Choice. Circle the letter corresponding to the best answer. 1. For the density curve shown, which statement is true? (a) The density curve is symmetric. (b) The density curve is skewed right. (c) The density curve is skewed left. (d) The density curve is Normal. (e) None of the above is correct. 2. For the density curve shown in Question 1, which statement is true?
8 (a) The mean is greater than the median. (b) The mean is less than the median. (c) The mean and median are equal. (d) The mean could be either greater than or less than the median. (e) None of the above is correct. 3. Suppose that 16-ounce bags of chocolate chip cookies are produced with weights that follow a Normal distribution with mean weight ounces and standard deviation ounce. The percent of bags that will contain between and ounces is about (a) 10. (b) 16. (c) 34. (d) 68. (e) none of the above 4. This is a continuation of Question 3. Approximately what percent of the bags will likely be underweight (that is, less than 16 ounces)? (a) 10. (b) 16. (c) 32. (d) 64. (e) none of the above 5.
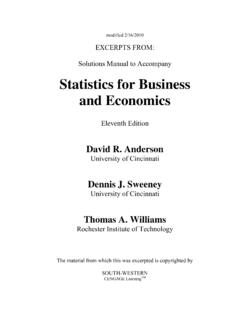
9 The plot shown at the right is a Normal probability plot for a set of data. The data value is plotted on the x axis, and the standardized value is plotted on the y axis. Which statement is true for these data? (a) The data are clearly Normally distributed. (b) The data are approximately Normally distributed. (c) The data are clearly skewed to the left. (d) The data are clearly skewed to the right. (e) There is insufficient information to determine the shape of the distribution. Chapter 2 1 Test 2B. 6. Which of the following is (are) a true statement? I. The area under a Normal curve is always 1, regardless of the mean and standard deviation. II. The mean is always equal to the median for any Normal distribution.
10 III. The interquartile range for any Normal curve extends from 1 to + 1 . (a) I and II. (b) I and III. (c) II and III. (d) I, II, and III. (e) None of the above gives the correct set of true statements. 7. Which of the following is NOT CORRECT about a standard Normal distribution? (a) The proportion of scores that satisfy 0 < Z < is (b) The proportion of scores that satisfy Z < is (c) The proportion of scores that satisfy Z > is (d) The proportion of scores that satisfy Z < is (e) The proportion of scores that satisfy Z > is 8. In some courses (but certainly not in an intro stats course!), students are graded on a Normal curve. For example, students within standard deviations of the mean receive a C; between and standard deviations above the mean receive a C+; between and standard deviations above the mean receive a B; between and standard deviations above the mean receive a B+, etc.