Transcription of TEXAS CRIME ANALYSIS
1 Chapter2 TTEXASEXASCCRIMERIMEAANALYSISNALYSISI ndex Crimes in TEXAS 2000-2015 CRIMEMEASUREMENTSC rime affects every Texan in some fashion. To gaina measurement of CRIME trends, TEXAS participatesin the Uniform CRIME Reporting (UCR) makes possible the ANALYSIS of CRIME trendsprimarily through the CRIME CRIME IndexTo track the variations in CRIME , the UCR data col-lection program uses a statistical summary toolreferred to as the CRIME Index. Rather than collect-ing reports of all crimes that were committed in aparticular year, UCR collects the reports of sevenindex crimes. The crimes in this group are all seri-ous, either by their very nature or because of thefrequency with which they occur, and present acommon enforcement problem to police agencies.
2 Crimes within this index can be further categorizedas violent crimes, which include murder, rape,robbery and aggravated assault, or as propertycrimes, which consist of burglary, larceny-theft, andmotor vehicle theft. By reducing the overall occur-rence of CRIME to this CRIME Index, the annualcomparison of CRIME trends is simplified. Althougharson and human trafficking are index crimes inthat the number of reported offenses is collected,neither is a part of the CRIME DefinitionIn 2014, the Rape definition was redefined by theFBI in the Uniform CRIME Reporting program as: Penetration, no matter how slight, of the vaginaor anus with any body part or object, or oralpenetration by a sex organ of another person,without the consent of the victim.
3 Statistics reported in this CRIME category includeassaults to commit rape; however, statutory rape(rape against a female under the age of consent)is Property Total 2015 CRIMEINTEXASTEXASCRIMEANALYSISCRIMETREND ST exas CRIME trends are analyzed using two sepa-rate methods: CRIME volume and CRIME rates. Crimevolume is merely the aggregate sum of the CrimeIndex. By comparing the CRIME volume from year toyear, trends in the number of crimes committed canbe studied. CRIME rates, however, are compiled tocompensate for changes in the size of TEXAS popu-lation and to show the number of people affectedby CRIME in a given population. TEXAS CRIME ratesare generally expressed as the number of crimesper 100,000 VolumeDuring calendar year 2015, there was a reportedtotal of 888,155 index offenses in TEXAS .
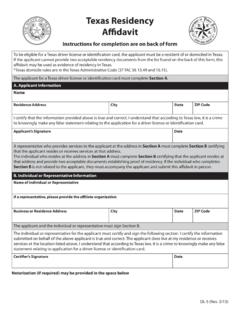
4 The crimevolume decreased percent when compared addition to the above offenses, there were3,536 cases of arson reported which representa decrease of percent from 2014. There werealso 285 human trafficking offenses committed RatesDuring calendar year 2015, TEXAS CRIME rate was3, crimes per 100,000 persons. This is adecrease of percent from the previous CRIME rate is based on the 2015 TEXAS popula-tion of 27,469, CRIME TrendsMonthly CRIME variations show that, in general, CRIME occurrences peaked in the month of index CRIME trend graphs are located inChapter ANALYSIS generally looks at the twocategories of CRIME discussed above: violentcrimes (or crimes against persons) and propertycrimes.
5 In 2015, percent of the CRIME Indexwere violent crimes and percent were Crimes by Month - 20152015 TEXAS Index CRIME by Volume20152014% ChangeMurder1,3141, ,20811, ,88330, Assault67,35865, CRIME Total112,763108, ,444166, ,867570, Vehicle Theft67,08167, CRIME Total775,392804, TOTAL888,155913, CRIME Rate by Offense20152014% CRIME , , Vehicle CRIME Total2, , TOTAL3, , CrimesViolent crimes involve the element of personalconfrontation between the perpetrator and the vic-tim. Because of their nature, violent crimes areconsidered to be more serious than propertycrimes. A reported 112,763 violent crimes occurredduring 2015, a percent increase from violent CRIME rate was crimes per100,000 Texans, a percent increase from therate posted in CrimesThe number of property crimes reported in 2015was 775,392.
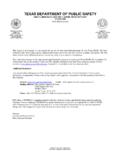
6 Property crimes decreased from 2014. Burglary accounted for of all property offenses, larceny-theftaccounted for percent, and motor vehicletheft accounted for percent. The 2015 prop-erty CRIME rate was 2, crimes per 100,000 Texans, a decrease of percent whencompared to the rate for CRIME Offenses 2005-2015 Type of CRIME in TexasViolent CRIME by OffenseProperty CRIME Offenses 2005-2015 Property CRIME by Offense72015 CRIMEINTEXASTEXASCRIMEANALYSISCLEARANCES For Uniform CRIME Reporting purposes, an offenseis cleared only when a law enforcement agencyhas identified the offender, enough evidence existsto press charges, and the subject is actually takeninto custody.
7 The arrest of one person can clearseveral crimes or several persons may be arrestedin the process of clearing one offense. Lawenforcement agencies may also clear a CRIME byexceptional means when some element beyondlaw enforcement control precludes the placing offormal charges against the enforcement officers cleared percent ofall index offenses reported to them in 2015, byarrest or exceptional means. Of the violent crimesreported, percent were cleared, while of all property crimes were relatively high clearance rate for violent crimescompared to the non-violent property crimes is, inpart, attributable to the element of confrontationbetween the victim and the perpetrator, which con-tributes to identification of the 2015, arrests of persons under the age of 18represented percent of all index crimes solved,accounting for percent of violent crimes clearedand percent of property crimes cleared.
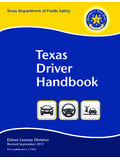
8 Of theviolent crimes solved, persons under the age of 18were responsible for percent of murder clear-ances, percent of rape clearances, of robbery clearances, and percent ofaggravated assault clearances. For non-violentcrimes solved, this age group accounted for of burglaries cleared, percent of lar-ceny-thefts cleared, and percent of the motorvehicle thefts total value of reported property stolen during2015 in TEXAS was $1,901,940, CRIME Clearance Rates(Percentage)Property Value Lost to CRIME 2005-2015 Property Value Lost to CRIME 2014 - 2015 Property by Type and ValueType of PropertyStolenRecoveredCurrency, Notes, Etc.$157,003,770$2,825,515 Jewelry & Precious Metals$151,624,616$13,011,635 Clothing & Furs$44,146,693$3,695,756 Locally StolenMotor Vehicles$760,807,891$413,428,753 Office Equipment$75,724,184$3,397,995 Televisions, Radios,Stereos, Etc.
9 $73,341,127$3,793,962 Firearms$25,618,416$1,972,055 Household Goods$34,776,613$993,288 Consumable Goods$13,228,363$2,001,010 Livestock$2,999,041$380,363 Miscellaneous$562,669,768$53,672,730 TOTAL$1,901,940,482$499,173,0628 Billions2015 CRIMEINTEXASTEXASCRIMEANALYSISONEMURDERE VERY 7 HOURSONERAPEEVERY 43 MINUTESONEAGGRAVATEDASSAULTEVERY 8 MINUTESONEMOTORVEHICLETHEFTEVERY 8 MINUTESONEBURGLARYEVERY 3 MINUTESONELARCENY-THEFTEVERY 57 SECONDSONEINDEXCRIMEEVERY 36 SECONDSTEXASCRIMECLOCK,2015 Note: As the most aggregaterepresentation of UCR data, theCrime Clock should be viewedwith care. The CRIME Clockconveys the relative frequencyof Index Crimes. This displaydoes not imply any regularity inthe commission of crimes, butrather, the clock represents theannual ratio of crimes to fixedtime 5 MINUTESONEPROPERTYCRIMEEVERY 41 SECONDSONEROBBERYEVERY 16 MINUTES2015 CRIMEINTEXASTEXASCRIMEANALYSIS10 There were 888,155 index CRIME offensesreported with a percent clearance rate forTexas in 2015.
10 The CRIME rate for the State of TEXAS was3, index offenses for every 100,000inhabitants. During 2015, TEXAS law enforcement officersmade 829,051 arrests. Of those arrested, were 16 years of age and under. The value of stolen property totaled$1,901,940,482. The offense of larceny-theft accounted for of all index crimes and had a clearancerate of percent. Firearms were used in percent of all mur-ders reported. There were 67,358 aggravated assaultsreported. Of these, percent were commit-ted by the use of hands, fists, and feet; involved a knife or cutting instrument;and percent involved a firearm. Residential burglaries accounted for 69 percentof all burglaries reported.