Transcription of Texas Population Projections 2010 to 2050
1 Texas Population Projections 2010 to 2050. The Texas Demographic Center produces Population Projections for 40 years beyond the most recent Census to help planners and policymakers anticipate future demand for services and pressures on infrastructure. In our most recent set of In this Brief: Projections , one migration scenario is employed in which the migration patterns observed in Texas between 2010 and 2015 are The latest Population assumed throughout the Projections horizon. Additionally, this Projections include more updated set of Projections includes a new race/ethnicity category, recent migration trends, a non-Hispanic Asian, and expands the age distribution to 95 years new race/ethnicity category, and older. and expand the age distribution to 95 years plus. This document provides a brief overview of the statewide Population Projections for 2010 to 2050 using the migration trends The newly added non- observed in Texas between 2010-2015.
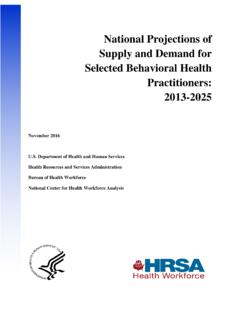
2 This scenario represents Hispanic Asian group is our recommended scenario as it most closely reflects the most projected to grow at the recent migration trends. Projections using the previous migration fastest rate, growing five-fold scenarios can be accessed by contacting our office. Our full by 2050. methodology can be found on our website. The Hispanic Population will likely surpass the non- Migration rates between 2010 and 2015 were somewhat Hispanic white Population by lower than migration rates observed in Texas between 2000 and 2022 but is not projected to 2010. This updated scenario yields a state Population approaching make up the majority of the million by 2050, which represents an percent increase state Population during the over that period. Projections horizon. Projected Geographic Distribution of the Population Much of the Population growth in Texas is projected Our Population Projections suggest the majority of Texas to come from the large urban counties will experience continued steady Population growth counties of Harris, Bexar, between 2010 and 2050.
3 This is especially the case for suburban Dallas, and Tarrant and neighboring suburban counties. The fastest growth is projected to occur in these suburban counties as well as in the Permian Basin area. The Texas Demographic Center is responsible for interpreting and communicating information on demographic and socioeconomic issues for the State of Texas and the general public and through robust and quality Projections , inform planning and policy-making related to the demand and provision of services across the State. JANUARY 2019. 2010-2015 Migration Trends Domestic migration made up a larger share of total net migration between 2010 and 2015, while international migration made up a larger share of total net migration between 2000 and 2010. This is one of the most important key differences in how the migration trends employed in the latest Population Projections differ from the migration trends observed between 2000 and 2010.
4 On average, net migration contributed approximately 178,000 migrants annually to the Texas Population between 2000 and 2010. By contrast, between 2010 and 2015, net migration contributed an average of 198,000 migrants annually to the state Population . In essence, an additional 20,000 net migrants were added annually to the Texas Population during this most recent migration period than during the last decade. Net migration to the state is comprised of domestic migration (or migrants moving to Texas from other states) and international migration (or immigrants moving to Texas from another country). Between 2000 and 2010, international migration made up over half, or 52 percent, of the total net migration to the state, and domestic migration contributed about 48 percent of the total net migration. In contrast, between 2010 and 2015, domestic migration made up over 60 percent of the total net migration to the state, compared to less than 38 percent added from international migration.
5 These differences in the migration patterns employed in our most recent Population Projections have significant implications for the projected findings. For instance, certain parts of the state are most impacted by Population changes associated with domestic migration, whereas other parts of the state are more impacted by changes in international migration. The latest Projections indicate faster and more growth in areas characterized by high domestic migration and slower growth in some border counties and other areas of the state with high shares of international migration. Additionally, domestic migration is more often characterized by migration of non-Hispanic whites, whereas international migration to Texas is more often characterized by migration of Hispanics. Therefore, the most recent Projections employing the 2010 to 2015 migration patterns produce an increased rate of growth for the non-Hispanic white Population and a slower rate of growth for Hispanics.
6 Indeed, if the patterns of strong domestic migration (mostly comprised of migration by non-Hispanic whites) and a smaller share of international migration continues into the future, our Projections indicate this pattern could mitigate and even compensate for the aging effect of the Baby Boom generation on the Texas Population . These Projections , like all Projections , are beholden to their underlying assumptions, which may or may not occur. One such key assumption is the migration scenario. Migration trends to Texas between 2010 and 2015 represent a high migration period, particularly domestic migration of non- Hispanic Whites. More recent data, yet to be incorporated into the Population Estimates and Projections Program, indicate slower and more diversified migration rates to Texas . As we continue to diligently observe emerging demographic trends in Texas and incorporate new data, we will update our Projections .
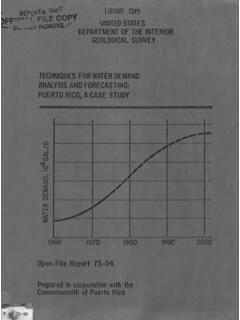
7 Counties surrounding the large urban centers of East Texas , and parts of South Texas . Dallas-Fort Worth, Houston, San Antonio, and Austin. All of these suburban counties are projected Projections by Age, Sex, and Race/Ethnicity to experience a growth rate greater than that of the State as a whole, with 27 of these counties projected Age to double their populations by 2050. Additionally, a The current Population Projections expand the number of counties in the Permian Basin and age distribution to include the Population aged 95. surrounding the Midland-Odessa area will also see years and older. This age group is captured in Tables continued growth. Although many of the large urban 1 and 2 below in the 85 plus age category. When counties are also projected to experience high compared to the other age categories, the age growth rates, only Harris, Bexar, and Travis Counties category including Texans over 85 years of age is are expected to grow faster than the State.
8 These projected to grow at the fastest rate. The eldest Projections also indicate slower growth in areas of seniors, those 85 years of age and older, are the Rio Grande Valley and El Paso County. Lastly, projected to nearly quadruple in size between 2010. our Projections suggest continued Population decline and 2050, approaching million. The age category in 99 counties, located mostly in West Texas , parts of including those 65 to 84 years of age is projected to 2. be the second fastest growing age group, nearly throughout the Projections horizon and ends with doubling in size by 2050 to a Population of over slightly more females than males. million. The younger age categories are projected to continue a slower but steady growth, with children, Race/Ethnicity ages 0 to 4 and 5 to 17, projected to be the slowest This most recent set of Projections includes growing age groups.
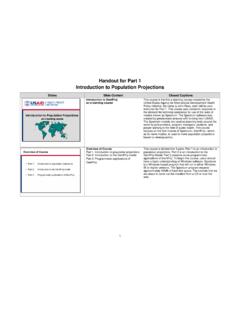
9 The addition of the non-Hispanic Asian race/ethnicity category. In previous Projections , the non-Hispanic Sex Asian group was part of the non-Hispanic Other The 2010 Census showed nearly equal racial/ethnic category. Projections indicate this new proportions of males and females in the State, with race/ethnicity group, non-Hispanic Asians, will grow slightly more females than males. Both groups are at the fastest rate, when compared to other racial/. projected to approach 24 million by 2050. The sex ethnic categories. The non-Hispanic Asian Population ratio is projected to remain about the same is projected to near 6 million by 2050, with a Projected Percent Population Change in Texas Counties, 2010 to 2050. 2010-2015 Migration Scenario Less than 0% (99). 0% to < 25% (76). 25% to < 50% (20). 50% to < 75% (18). 75% to < 100% (14). 100% and greater (27). 3. Population growth rate of more than 5 times the 2010.
10 Population . The non-Hispanic Asian Population is projected to make up over 12 percent of the total State Population in 2050. The non-Hispanic Other race/ethnicity category, consisting mostly of Population of two or more races, continues to grow rapidly and is projected to grow to nearly 2 million by 2050, tripling in size during this time period. The Hispanic Population is growing at a rapid rate as well as increasing its proportion of the total State Population . Our Projections suggest the Hispanic Population will more than double its size in 2010 to over 20 million by 2050. The non-Hispanic black Population is also projected to suggest the Hispanic Population will likely surpass the double in size, growing to over 6 million by 2050. The non-Hispanic White Population in size by 2022. non-Hispanic white Population is projected to grow at However, the Hispanic Population is not projected to a steady but slower pace relative to the other race/ make up a majority of the Texas Population ethnicity categories, growing to a total Population of throughout this projection 's 2050 horizon.