Transcription of Text.wpc 4/17/03 3:19 PM Page 63 HOW TO READ …
1 IRIS LIGHTINGSYSTEMS63 PHOTOMETRIC TERMSL umens:Luminous flux, measured in lumens (lm), is the total amount of light produced by a source without regard to direction. The luminous flux is provided by lampmanufacturers and common lumen values are included in the lamp :Luminous intensity, measured in candela (cd), is the amount of light produced in a specific direction. Graphically, this information is compiled into polarformatted charts that indicate the intensity of light at each angle away from 0 lamp axis(nadir). The numeric information is also available in tabular :Illuminance, measured in footcandles (fc), is the measure of the quantity of light that arrives on a surface. Three factors that affect illuminance are the intensity of the luminaire in the direction of the surface, the distance from the luminaireto the surface, and the angle of incidence of the arriving light. Although illuminance cannotbe detected by our eyes, it is a common criterion used in specifying :Luminance measured in candelas/meter2(cd/m2) is the quantity of lightthat leaves a surface.
2 It is what the eye perceives. Luminance will reveal more about the quality and comfort of a design than illuminance :The cutoff angle of a luminaire is theangle between the vertical axis (nadir) and the line of sight when the brightness of the source or its reflected image is no longer visible. This is the deciding factor for visual comfort in a lighting system. Deep cutoff optics provide lowbrightness luminaires, allowing the eye to seemore effectively. The shielding angle is the complementary angle to the cutoff angle. Translating Center Beam Optics:Adjustableaccent fixtures historically have been inefficientluminaires. As lamps were aimed away from thevertical axis, light from the lamp was wasted either trapped within the luminaries or re-reflectedaway from the intended target because the lampaimed into the reflector cone or baffle. IRiS products solve this problem of well-shielded fixtures with its translating center beam opticsdesign.
3 As the lamp is tilted, its axis pivots aboutthe center of the aperture at the ceiling plane. Light from the center beam does not aim into thereflector. In addition, the lamp translates towardsthe aperture to maximize more light to exit through the opening. Translating center beamoptics increases the amount of light from an adjustable accent, allowing incandescent sources to be used with increased INFORMATIONP hotometric information is provided with each fixture to assist in the lighting layout. Test Number: The photometric test number identifies the specific lamp and luminaire combination Information:Identifies the lamp designation and initial lumen output. Beam Spread:Lamp beam spread to 50% maximum Beam Candle Power (CBCP):Maximum candlepower of lamp at :Cutoff of lamp and lamp image angle as given from Criterion (SC):Mathematically classifies the maximum spacing allowed in order to maintain reasonably even illumination.
4 Luminaire Spacing = SC x Height to Illuminated PlaneEfficiency: Compares how much light is emitted from a luminaire; however, efficiency does not indicate the quality of light or visual comfort of a luminaire. Efficiency % =Luminaire LumensLamp Lumens Unit LPW:Indicates total system efficacy; however, unit LPW provides no indication of the light s direction or quality. Some luminaires with a lower LPW may produce a moredesirable lighting effect than a luminaire with a higher =Lamp Lumens x Luminaire EfficiencyLuminaire Watts Candelas:Polar candela diagrams graphically illustrate the light intensity at specificdirections from nadir. Intensity is on the vertical axis, and radial lines indicate elevationangles at 30, 60 and 90 from nadir. For symmetrical downlights, only one half ofa plane of data is shown; for wall washers, both wall and downlight data are specification sheets for full diagrams of non-rotationally symmetric :Averageluminance numerically indicatesthe brightness of the is provided forvarious viewing directions, the0 direction being where the wallwash or accent light is aimed.
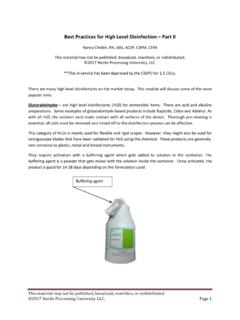
5 Toconvert the preferred cd/m2measure to the olderfootlamberts, multiply by , luminance reveals more about the quality and comfort of a lighting system than illuminance TO read PHOTOMETRICSC andelaLumenFootcandlecd/m2 EyeShielding AngleCutoff AngleCandelasVerticalAnglecd90 085 075 065 055 045 11235 41325 54715 5835 5660 562 LuminanceDegreecd/m285 075 065 055 045 1128690 0 Accent or Wall Wash DirectionLuminance Viewing Directions18 0 90 4/17/03 3:19 PM Page 63 BARE LAMP VS REAL WORLD DATAA ccent ( projector) lamp photometrics, based upon published bare lamp data, vastlyoverstate the performance of recessed low voltage adjustable accent fixtures; and requirelighting designers to estimate losses within the fixture. Additional losses, from actualoperating voltage and actual vs. designed filament position within the reflector, willfurther reduce light GE Q50MR16/C/NSP15 tilted 30oand aimed on a wall 2 from the fixtureVoltage (v)Footcandles (fc)Published Bare Lamp the shelf Bare the shelf lamp as tested in for Truvolt xfr.
6 On switch or for laminated xfr. on for laminated xfr. on the published bare lamp data produces 361 fc, the off the shelf lamp tested bareproduces 320fc (11% less). Once this lamp is tested in the Iris fixture, the same off theshelf lamp produces 252 fc (21% less). Worse still is the additional loss from the industry standard laminatedtransformer on a dimmer, which produces a total loss of 55% from thepublished bare lamp these tremendous losses, IRiS publishes "real world photometrics" for ourlow voltage fixtures using off the shelf lamps installed in fixtures using a clear lens andoperated at LIGHTINGSYSTEMS64 LFCLWCBLWD30 30 WDCBFCFC4 3 Distance from WallDistance Down from Ceiling2 1 0 30 Cone of LightDistance toInitial NadirBeamIlluminated diameter is to 50% of maximum TO read PHOTOMETRICS(continued)LIGHT LOSS FACTORSMany variables affect the illumination level after installation. Two of the greatest factors are Lamp Lumen Depreciation (LLD) and Luminaire Dirt Depreciation (LDD).
7 Additional light loss factors affect the illumination level over time. It is the designer sresponsibility to understand and apply the appropriate lumen depreciation accounts for the reduction in lumen output that all lampsexperience as they age. Typical factors are listed in the following Halogen dirt depreciation accounts for the reduction in light output of a fixture due to accumulation of dirt on the surfaces of the fixture. The three factors that determine the luminaire dirt depreciation are the optical distribution, cleanliness of the environment and its cleaning Open UnitLDD Lensed UnitVery Aiming:Beam aiming diagrams allow a designer to easily select the proper distance from a wall to locate a luminaire and get the center beam of the lamp where desired. For lighting art objects on a wall, the 30 aiming is preferred. At this angle, 1/3 of thebeam's length will be above the CB point, and 2/3 will be below it.
8 Thus, if a painting isthree feet tall, plan for the CB to be aimed 1 foot below the top of the painting. For increased modeling of three-dimensional objects, two lights are typically used, a key light and fill light. Both are aimed at least 30 elevation and are located 45 off axis. WALL WASH DATAA symmetric wall wash distributions are provided with two types of performance charts. A single-unit performance chart plots the illuminance levels at one-foot increments alongand down a wall. Multiple-unit performance charts report theperformance of the middle units computedfrom a four unit layout. Illuminance valuesare plotted centerline of unit and centeredbetween Illuminance values are cosine-correctedinitial No room surface inter-reflectionscontribute to illuminance Changing unit spacing will affect theillumination FC = Existing Spacing x Average Table FC LevelNew Spacing CLSpacingSetbackDD CONE OF LIGHTU seful tools for rapid lighting comparisons and calculations, cones of light calculate initialfootcandle levels for a single unit based upon point calculation techniques.
9 Beam diametersare rounded to the nearest half-foot. Downlight:These cones of light provide single-unit performance with no inter-reflectionsfrom surfaces. Data listed is for mounting height, footcandle values at nadir, and resulting beam diameter. Please note:1. Mounting heights are from the fixture plane to the illuminated work plane (task).2. Footcandle values are at nadir (0 ).3. Beam diameter is defined as 50% maximum footcandle values. This allows rapid spacing of units for uniform illumination, allowing overlapping of 50% Maximum footcandle values may not always occur at nadir; batwing distributions produce maximum values surrounding Proration factors are provided for other reflector :Patterns of light from adjustable accent luminaires are dependent upon the lamp type, wattage, lamp tilt and location of illuminated plane. Single-unit performance data is provided for horizontal and vertical planes, with the lamp tilted at either 0 , 30 , or 45 aiming.
10 Please angle is measured from D is distance from the floor or Footcandle values are maximum Effective Visual Beam (EVB) is determined by 50% of the maximum footcandle Beam length and width based upon the CB is the distance at which center beam of the lamp occurs either from the ceiling or nadir. IRIS LIGHTINGSYSTEMS65 POINT-TO-POINT CALCULATIONSThe calculation of footcandles at a point, no matter if it is on a horizontal, vertical ortilted surface, can be accomplished with the inverse square law. The law states that theilluminance is proportional to the candlepower of the source in the given direction andinversely proportional to the square of the distance from the source. In addition, as asurface is tilted away from the source, illuminance will decrease in a ratio equal to thecosine of the angle of incidence. The inverse square law formula can be expressed in various ways; the two most useful follow.