Transcription of The Changing Racial and Ethnic Makeup of New …
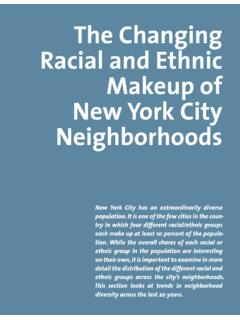
1 STATE OF NEW york city S HOUSING & NEIGHBORHOODS 2011 29 State of the New york city s Property Tax The Changing Racial and Ethnic Makeup of New york city NeighborhoodsNew york city has an extraordinarily diverse population. It is one of the few cities in the coun-try in which four different Racial / Ethnic groups each make up at least 10 percent of the popula-tion. While the overall shares of each Racial or Ethnic group in the population are interesting on their own, it is important to examine in more detail the distribution of the different Racial and Ethnic groups across the city s neighborhoods. This section looks at trends in neighborhood diversity across the last 20 THE FURMAN CENTER FOR REAL ESTATE & URBAN POLICY30 THE FURMAN CENTER FOR REAL ESTATE & URBAN POLICY According to the 2010 decennial census, 33 percent of New york city residents are white, 26 percent are Hispanic, 26 percent are black, and 13 percent are Figure A reports the city s Racial / Ethnic Makeup in each of the past three decennial censuses, and Table 1 compares the trends in the city to those of the nation s four other largest cities.
2 While the population of all of these cities is diverse, New york is the only one of the five in which each of the four major Racial and Ethnic groups makes up at least 10 percent of the the diversity of New york city s population is not reflected in many of the city s neighborhoods, over the past 20 years the Racial and Ethnic Makeup of the city s neighborhoods (census tracts) has increasingly come to look more like that of the city Our analysis of the 2010 census shows that in 51 percent of the city s census tracts, at least two Racial or Ethnic groups each constitute 20 percent or more of the population, compared with 38 percent of census tracts in 1990. Nonetheless, nearly half of the city s neighborhoods remain dominated by a single Racial or Ethnic group.
3 New york city s white residents are the most concentrated of all Racial /eth-nic groups. White residents represent the majority of the population in 24 percent of New york city census tracts, and 59 percent of the white population live in these tracts. New york city Neighborhood TypesThere are many potential ways to categorize the Racial / Ethnic Makeup of a neighborhood. For this analysis, we have defined neighborhoods as majority white, major-ity black, majority Hispanic, or majority Asian if more than half of the residents identify as belonging to the respective category and no other single group makes up more than 20 percent of residents. The categories white-black, white-Hispanic, and white-Asian include 1 We treat multiple-race or -ethnicity responses to the census race/ethnicity questions slightly differently in this analysis than in the reference pages at the end of this pub-lication.
4 Here, black includes responses of black alone, or black in combination with other races/ethnicities, Hispanic includes Hispanic in combination with any race/ethnicity and not classified as black, Asian includes Asian alone or in combination with any other races/ethnicities but not classified as black or Hispanic, white includes white non-Hispanic responses, and other includes any remaining This analysis focuses on relatively small geographical areas census tracts as neigh-borhoods. We also adjust the boundaries of tracts that were changed from one census to the next in order to make consistent comparisons over time. There are 2,106 census tracts in New york city , with an average population of 3,900 persons per census where at least 20 percent of residents are white and at least 20 percent identify as the second respective category.
5 White-mixed tracts have more than 20 percent white residents and multiple other groups, each with more than a 20 percent representation. We refer to these four white- neighborhood types as inte-grated neighborhoods in the discussion below. Finally, in mixed-minority neighborhoods, less than 20 percent of the population is white and at least two other groups make up more than 20 percent each of the tract popu-lation, or no group constitutes a majority of residents. While treating mixed-minority neighborhoods differ-ently from integrated neighborhoods may seem arbi-trary, we show later that these neighborhoods differ significantly from the integrated neighborhoods on a variety of socioeconomic indicators.
6 Table 2 summa-rizes these neighborhood definitions and shows how frequently each type of neighborhood occurred in each of the past three censuses. Perhaps the most striking changes are the large decline between 1990 and 2000 in the share of neighborhoods that are majority white, from percent to percent, as well as the growth in mixed-minority neighborhoods from percent of tracts in 1990 to percent in 2010. The citywide increase in the Hispanic and Asian populations is reflected in increases in the share of majority Hispanic, majority Asian, and white-Asian neighborhoods. A more detailed analysis of how Racial / Ethnic composition has changed in each neighborhood type is given A: New york city Racial / Ethnic Groups: Levels and Sharesn White n Black n Hispanic n Asian n Other2040608010012020041990 Millions20002010200520062007200820092010 0246810045681043%29%21%7%36%28%24%11%33% 26%26%13%Source: Census Bureau, Decennial Census (1990, 2000, and 2010).
7 STATE OF NEW york city S HOUSING & NEIGHBORHOODS 2011 31 Racial and Ethnic Makeup of NYC NeighborhoodsTable 1: Racial / Ethnic Makeup of Major Cities New york city Chicago Los Angeles Houston PhiladelphiaWhite 1990 2000 2010 1990 2000 2010
8 1990 2000 2010 & Pacific Islander 1990 2000 2010 1990 2000 2010 : Census Bureau, Decennial Census (1990, 2000, and 2010) Table 2: Neighborhood Type Definitions and Percentage Breakdown % of Tracts # of CensusNeighborhood Type Description 1990 2000 2010 Tracts 2010 Majority White >50% white; all other groups <20% each 501 Majority Black >50% black; all other groups <20% each 387 Majority Hispanic >50% Hispanic; all other groups <20% each 108 Majority Asian >50% Asian.
9 All other groups <20% each 39 White-Black >20% white; >20% black; all other groups <20% each 59 White-Hispanic >20% white; >20% Hispanic; all other groups <20% each 221 White-Asian >20% white; >20% Asian; all other groups <20% each 205 White-Mixed >20% white; at least two other groups >20% 96 Mixed-Minority <20% white; no other groups >50% 498 Source: Census Bureau, Decennial Census (1990, 2000, and 2010).
10 Note: Tract boundaries are defined to be consistent across THE FURMAN CENTER FOR REAL ESTATE & URBAN POLICYT able 4: Average Tract Characteristics by Neighborhood Type Educational Attainment: Households Bachelor s with Children Average Degree and Homeowner- Foreign-Born Under 18 Household Poverty Rate Higher ship Rate Population Years Old IncomeWhite Majority $124,470 Black Majority $57,847 Hispanic Majority $48,485 Asian Majority $51,656 White-Black $66,898 White-Asian $75.