Transcription of The Chart Clinic – Second in a Series
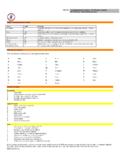
1 On most enroute charts, there are one or moreshaded areas on the front panel that representareas covered by area charts. With the redraw ofthe low altitude enroute charts in 1997 usingbetter scales, many of the area charts are no longerneeded. The location of each area Chart isidentified by the name of the area Chart plus thesmall city of the most useful pieces of information oneach of the charts is the information includedbelow the front map layout under the title CHANGES. Each time a change is made to anenroute Chart , the Chart is revised, and the changethat caused the revision is listed on the front panelof the Chart . As an example, in the illustrationshown below, the Big Fork, Minnesota NDB wascommissioned. Also the Suzli, Minn NCRP (non-compulsory reporting point) has been designatedon US(LO) Chart 25. To help locate the effectedchange, the radial from the reference facility (inthis case the 046 radial from the Duluth, MinnVOR) is ValidityPilots trained in the United States know that lowaltitude airways are good up to, but not including18,000 feet.
2 They also know that all airspace at14,500 feet and above is controlled but what ifyou are going to fly in South America, in Africa,over Australia? Well, you get the is why there is a paragraph just below thechart layout diagram. In that paragraph, there isan explanation of the airspace and airway limits for the Chart . In the United States,the explanation is quite simple,but in many areas, the enroutechart covers many countrieswhich all seem to have differentlimits to their airways andairspace. So this paragraph canbe very ZonesYou will note that the timezone boundaries are notlocated on the internalportion of each enroutechart, but are found onthe front panel. Theboundary between timezones is represented bya Series of letter T s. With the change todaylight savings timein the spring and backevery fall, charts include the conversion toCoordinated Universal Time (UTC) for bothdaylight savings time and standard time withineach time zone.
3 This conversion factor can befound toward the top of the Index of Charts on thefront panel of each enroute Location GuideBelow the list of changes is a City Location Guideto help you find cities much easier. There is aminiature Chart layout with the identifier of eachpanel on the face of the enroute Chart as well as alist of all the cities on the Chart which have an IFRairport. Some of the cities have more than oneairport. As an example, Minneapolis, which has five IFR airports, can be found on panel AltitudesA reminder showing the appropriate cruisingaltitudes for VFR and IFR is included in schematicform at the bottom of the front panel. FAR that the east-west hemispheric rules apply onlyfor operations in non-controlled , the odd or even thousand-foot altitudesdo not apply within controlledairspace since ATCassigns the appropriate altitude for IFR , that degrees 360 through 179, and180 through 359, apply to the magnetic courseand not to the magnetic heading.
4 This is true in the United States but varies occasionally forinternational Chart Clinic Second in a SeriesThis Series of articles is designed forinstrument pilots who want to get themaximum value from their Jeppesen last month s article, we covered those seemingly millions of Chart symbols. This month we ll takea tour of enroute portion of the Jeppesen Enroute Chart mostoften overlooked is the front panel. It containssome helpful information, plus other data that can be critical to the top of each Chart are two numbers thatshow the title. Each number has an arrow directingthe pilot to turn to the desired geographical below each Chart number is the scaleof the mentioned previously, most nations haveagreed to the ICAO 28-day cycle (or every other28-day cycle for the US and Canada). As shownbelow in the illustrated enroute Chart panel, theeffective date of this Chart is 6 November date represents day 1 of the cycle.
5 Morespecifically, the Chart is effective at 0901 the NeatlineThe enroute Chart outline, enclosed within the solid line, includes awealth of informa-tion when examinedclosely. Note thesolid lines in themiddle of the illus-trated enroute chartshow that the Chart in your hand is theUS(LO)25 and number of cities areincluded on the Chart witha dot located near the city. These dots representcity locations and are fororientation purposes. Thesealso are the names used onthe index panels on the backside of the TERPSTRAJ ames E. Terpstra is seniorcorporate vice president, flightinformation technology atJeppesen. His ratings includeATP, single and multi-engine,airplane and instrument flightinstructor. His 6,000+ hoursinclude 3,200 instructing. For comments, please 2345 on Sundays. During the other times, it isClass G article concludes the discussion of the enroute text pages and the front and back panel information on the enroute charts.
6 In the next article, the inside of the Chart will be GreatestBreakthroughSince The Sound BarrierNew Charts are more pilot-friendly than new Briefing Strip format makesapproach charts better top to multicolor Enroute charts reduceclutter and make the information you needeasier to find. And JeppView gives you CD-ROM Chart convenience. Jeppesencontinues to innovate and invest incharting. You ll find our charts workharder, smarter and offer more valuethan ever. You have to see itto believe Hemisphere1-800-894-9478303-784-4274 Eastern Hemisphere+49 69 96 12 48 51 Making Every Mission sounds like a fancy marketing term (it is) butit really works! The marketing term for the zigzagindex located on the back panel of each lowaltitude enroute Chart is Zig-dex . To use the Zig-dex, simply place the thumb of either the rightor left hand on the name at the top of the backpanel and slide the thumb to the inside of thechart.
7 This will open the Chart to the desired further coordinate the Zig-dex names, refer tothe geographical coverage in the first illustration inthis article. The names that are shown are thesame names that appear at the top of each Zig-dexpanel. For example, on the front panel ofUS(LO)26, Watertown, Minneapolis, and Eau Claireare shown with dots. These are the same names atthe top of the back , notice the panel numbers next to the citynames at the top of the Zig-dex. These are used asreference numbers for the City Location Guide. Forexample, use your left thumb and press the panellabeled 2 Minneapolis and slide your thumbinside and now you should be able to seeMinneapolis in the lower right corner which ispanel 2D. (If you actually have the US(LO)25/26,try it. It really works!!)Airspace Restricted AreasNormally, all of the information concerning specialuse airspace (SUA) areas are found on the face ofthe enroute Chart near the respective area.
8 Incases where Chart congestion limits the amount ofroom, special use airspace and their limits are listedon the bottom of the front panel just above thecruising altitude symbol, or at the top of the backpanel. Additionally, all part-time terminal airspaceis included on the Chart panel. For example, theClass E terminal airspace around Bemidji-BeltramiCounty Airport is effective from 0445 to 2345 localtimes on Mondays through Saturdays, and 0800