Transcription of The Chi-Square and F Distributions - Statpower
1 IntroductionThe Chi-Square DistributionTheFDistributionNoncentral Chi-Square DistributionNoncentralFDistributionThe Chi-Square andFDistributionsJames H. SteigerDepartment of Psychology and Human DevelopmentVanderbilt UniversityJames H. SteigerThe Chi-Square andFDistributionsIntroductionThe Chi-Square DistributionTheFDistributionNoncentral Chi-Square DistributionNoncentralFDistributionIntro ductory distribution Theory1 Introduction2 The Chi-Square DistributionSome Basic PropertiesBasic Chi-Square distribution Calculations in RConvergence to NormalityThe Chi-Square distribution and Statistical Testing3 TheFDistributionCharacterization of theFDistributionTheF-Ratio Test4 Noncentral Chi-Square DistributionIntroductionCalculations with the Noncentral Chi-Square DistributionThe Effect of Noncentrality5 NoncentralFDistributionIntroductionAsymp totic BehaviorCalculations in the NoncentralFJames H.
2 SteigerThe Chi-Square andFDistributionsIntroductionThe Chi-Square DistributionTheFDistributionNoncentral Chi-Square DistributionNoncentralFDistributionIntro ductionIn this module, we review basic facts about the central andnoncentral 2andFdistributions, and how they arerelevant to statistical H. SteigerThe Chi-Square andFDistributionsIntroductionThe Chi-Square DistributionTheFDistributionNoncentral Chi-Square DistributionNoncentralFDistributionSome Basic PropertiesBasic Chi-Square distribution Calculations in RConvergence to NormalityThe Chi-Square distribution and Statistical TestingThe Chi-Square DistributionBasic CharacterizationSuppose you have an observationxtaken at random from anormal distribution with mean and variance 2that yousomehow can characterize this as a realization of a randomvariableX, whereX N( , ).
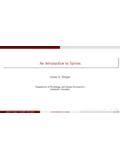
3 Now suppose we were to transformXtoZ-score form, ,Z= (X )/ . Then we would have a random variableZ N(0,1).Finally, suppose we were to squareZ. This randomvariableZ2is said to have achi- square distribution withone degree of writeZ2 H. SteigerThe Chi-Square andFDistributionsIntroductionThe Chi-Square DistributionTheFDistributionNoncentral Chi-Square DistributionNoncentralFDistributionSome Basic PropertiesBasic Chi-Square distribution Calculations in RConvergence to NormalityThe Chi-Square distribution and Statistical TestingThe Chi-Square DistributionSome PropertiesA 21random variable is essentially a folded-over andstretched out s a picture of the density function of a standardizednormal random variable and a 21random variable overlaidon the same H.
4 SteigerThe Chi-Square andFDistributionsIntroductionThe Chi-Square DistributionTheFDistributionNoncentral Chi-Square DistributionNoncentralFDistributionSome Basic PropertiesBasic Chi-Square distribution Calculations in RConvergence to NormalityThe Chi-Square distribution and Statistical TestingThe Chi-Square DistributionSome Properties> curve(dchisq(x,1),0,9,col="red",lty=1,xl im=c(-9,9),ylim=c(0, ))> curve(dnorm(x),-9,9,col="blue",lty=2,add =T)> abline(v=0) (x, 1)James H. SteigerThe Chi-Square andFDistributionsIntroductionThe Chi-Square DistributionTheFDistributionNoncentral Chi-Square DistributionNoncentralFDistributionSome Basic PropertiesBasic Chi-Square distribution Calculations in RConvergence to NormalityThe Chi-Square distribution and Statistical TestingThe Chi-Square DistributionSome PropertiesWith a little thought, you can see that because the graph is folded over , the 95th percentile of the 21distribution isthe square of the percentile of the standard mean of a 21variable is variance of a 21variable is sum of independent 21variables is said to have achi- square distribution with degrees of freedom, , j=1 21 2 (1)
5 The preceding results, along with well-known principlesregarding the mean and variance of linear combinations ofvariables, implies that, for independent chi-squares having 1and 2degrees of freedom, 2 1+ 2 2 2 1+ 2(2)E( 2 ) = (3)Var( 2 ) = 2 (4)James H. SteigerThe Chi-Square andFDistributionsIntroductionThe Chi-Square DistributionTheFDistributionNoncentral Chi-Square DistributionNoncentralFDistributionSome Basic PropertiesBasic Chi-Square distribution Calculations in RConvergence to NormalityThe Chi-Square distribution and Statistical TestingBasic CalculationsWe perform basic calculations in R using thedchisqfunction to plot the density,pchisqto compute cumulativeprobability, andqchisqto compute percentage ve already seen an example ofdchisqin our earlierchi- square distribution we calculate the cumulative probability of a value in a 22distribution.
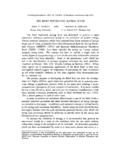
6 > pchisq( ,2)[1] we calculate the 95th percentile of a 25variable.> qchisq(.95,5)[1] H. SteigerThe Chi-Square andFDistributionsIntroductionThe Chi-Square DistributionTheFDistributionNoncentral Chi-Square DistributionNoncentralFDistributionSome Basic PropertiesBasic Chi-Square distribution Calculations in RConvergence to NormalityThe Chi-Square distribution and Statistical TestingConvergence to NormalityRecall that theX2 variate is the sum of , as degrees of freedom increase, thedistribution of the 2 variate should tend towardnormality, because of the central limit is a picture of Chi-Square variates with 2,10,50, and100 degrees of H. SteigerThe Chi-Square andFDistributionsIntroductionThe Chi-Square DistributionTheFDistributionNoncentral Chi-Square DistributionNoncentralFDistributionSome Basic PropertiesBasic Chi-Square distribution Calculations in RConvergence to NormalityThe Chi-Square distribution and Statistical TestingConvergence to Normality> par(mfrow=c(2,2))> curve(dchisq(x,2),0,qchisq(.))
7 995,2))> curve(dchisq(x,10),0,qchisq(.995,10))> curve(dchisq(x,50),0,qchisq(.995,50))> curve(dchisq(x,100),0,qchisq(.995,100)) (x, 2) (x, 10) (x, 50) (x, 100)James H. SteigerThe Chi-Square andFDistributionsIntroductionThe Chi-Square DistributionTheFDistributionNoncentral Chi-Square DistributionNoncentralFDistributionSome Basic PropertiesBasic Chi-Square distribution Calculations in RConvergence to NormalityThe Chi-Square distribution and Statistical TestingThe Chi-Square distribution and Statistical TestingWe ve sketched the basic properties of the 2distribution,but how do we employ this distribution in statisticaltesting?A key result in statistical theory connects the 2with thedistribution of the sample you haveNindependent, identically distributed(iid) observations from a normal distribution with mean and variance (N 1)s2 2 2N 1(5)This, in turn, implies that the sample variance has adistribution that has the same shape as a chi-squaredistribution withN 1 degrees of freedom, since we canrearrange the preceding equation ass2 2N 1 2N 1(6)James H.
8 SteigerThe Chi-Square andFDistributionsIntroductionThe Chi-Square DistributionTheFDistributionNoncentral Chi-Square DistributionNoncentralFDistributionSome Basic PropertiesBasic Chi-Square distribution Calculations in RConvergence to NormalityThe Chi-Square distribution and Statistical TestingTest on a Single VarianceThe results on the preceding slide pave the way for asimple test of the hypothesis that 2= 2=a, then(N 1)s2a 2N 1(7)So we have a simple method for testing whether 2=a:Simply compare (N 1)s2/awith the upper and lowerpercentage points of the 2N H. SteigerThe Chi-Square andFDistributionsIntroductionThe Chi-Square DistributionTheFDistributionNoncentral Chi-Square DistributionNoncentralFDistributionSome Basic PropertiesBasic Chi-Square distribution Calculations in RConvergence to NormalityThe Chi-Square distribution and Statistical TestingTest on a Single VarianceAn ExampleExample (Test on a Single Variance)Suppose you wish to test whether 2= 225, and you observeN= 146 observations from the population which is assumed tobe normally distributed.
9 You observe a sample variance Perform the Chi-Square test with =. test statistic is(146 1) area above in a 2145distribution is> 1-pchisq( ,145)[1] get the two-sidedp-value, we double this, obtaining ap-value of> 2*(1-pchisq( ,145))[1] this is less than .05, the null hypothesis is rejected. Wecan also confirm that exceeds the critical value. Sincethe test is two-sided, the critical value is> qchisq(.975,145)[1] H. SteigerThe Chi-Square andFDistributionsIntroductionThe Chi-Square DistributionTheFDistributionNoncentral Chi-Square DistributionNoncentralFDistributionSome Basic PropertiesBasic Chi-Square distribution Calculations in RConvergence to NormalityThe Chi-Square distribution and Statistical TestingConfidence Interval on a Single VarianceThe distributional result for a single variance implies thatPr( 2N 1, /2 (N 1)s2 2 2N 1,1 /2)= 1 (8)If we take the reciprocal of all 3 sections of the inequalityand reverse the direction of the signs, then multiply all 3sections by (N 1)s2, we obtainPr((N 1)s2 2N 1,1 /2 2 (N 1)s2 2N 1, /2)= 1 (9)
10 The outer two sections of this latter inequality are thereforethe endpoints of a 1 confidence interval for H. SteigerThe Chi-Square andFDistributionsIntroductionThe Chi-Square DistributionTheFDistributionNoncentral Chi-Square DistributionNoncentralFDistributionSome Basic PropertiesBasic Chi-Square distribution Calculations in RConvergence to NormalityThe Chi-Square distribution and Statistical TestingConfidence Interval on a Single VarianceAn ExampleExample (Confidence Interval on a Single Variance)Suppose you observeN= 146 observations from the populationwhich is assumed to be normally distributed. You observe asample variance of What is a 95% confidence intervalfor R, we compute the lower and upper limits as> <- > N <- 146> lower <- (N-1)* / qchisq(.)