Transcription of The Correlation Coefficient - Biddle
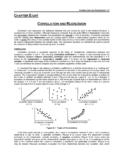
1 Chapter 2 The Correlation Coefficient In chapter 1 you learned that the term Correlation refers to a process for establishing whether or not relationships exist between two variables. You learned that one way to get a general idea about whether or not two variables are related is to plot them on a scatterplot . If the dots on the scatterplot tend to go from the lower left to the upper right it means that as one variable goes up the other variable tends to go up also. This is a called a positive relationship . On the other hand, if the dots on the scatterplot tend to go from the upper left corner to the lower right corner of the scatterplot, it means that as values on one variable go up values on the other variable go down.
2 This is called a negative relationship . If you are unclear about this, please return to Chapter 11 and make sure that you understand what is written there before you continue! While using a scatterplot is an appropriate way to get a general idea about whether or not two variables are related, there are problems with this approach. These include: Creating scatterplots can be tedious and time consuming (unless you use a computer) A scatterplot does not really tell you exactly how strong any given relationship may be If a relationship is weak as most relationships in the social sciences are it may not even be possible to tell from looking at a scatterplot whether or not it exists It is difficult to make accurate predictions about variables based solely on looking at scatterplots unless the relationship is very strong And so let s add a new tool to add to our statistical tool box.
3 What we need is a single summary number that answers the following questions: a) Does a relationship exist? b) If so, is it a positive or a negative relationship? and c) Is it a strong or a weak relationship? Additionally, it would be great if that same summary number would allow us to make accurate predictions about one variable when we have knowledge about the other variable. For example, we would like to be able to predict whether or not a convicted criminal would be likely to commit another crime after he or she was released from prison. We are not asking for much, are we?
4 Well, there is such a number. It is called the Correlation Coefficient . Correlation Coefficient : A single summary number that gives you a good idea about how closely one variable is related to another variable. 1 Excerpted from The Radical Statistician by Jim Higgins, Copyright 2005 Used with permission of Author The Correlation Coefficient In order for you to be able to understand this new statistical tool, we will need to start with a scatterplot and then work our way into a formula that will take the information provided in that scatterplot and translate it into the Correlation Coefficient .
5 As with most applied statistics, the math is not difficult. It is the concept that is important. I typically refer to formulae as recipes and all the data as ingredients. The same is true with the formula for the Correlation Coefficient . It is simply a recipe. You are about to learn how to cook up a pie a nice and tasty Correlation Pie! Let s begin with an example. Suppose we are trying to determine whether a the length of time a person has been employed with a company (a proxy for experience) is related to how much the person is paid (compensation). We could start by trying to find out if there is any kind of relationship between time with company and compensation using a scatterplot.
6 In order to answer the question Is compensation related to the length of time a person has worked for the company? we could do something like the following: STEP 1 Create a data file that contains all individuals employed by the company during a specific period of time. STEP 2 Calculate how long each person has been employed with the STEP 3 Record how much each person is compensated in, say, hourly pay (in the real world you would probably use annual total compensation). STEP 4 Create a scatterplot to see if there seems to be a relationship. Suppose that our study resulted in the data found in table 12-1, below.
7 TABLE 2-1 Example Data File Containing Fictitious Data Employee s Initials Compensation (In dollars per hour) Number of months employed with the company 5 45 15 32 18 37 20 33 25
8 24 25 29 30 26 34 22 38 24 50 15 2 Chapter 2 Once we have collected these data, we could create the scatterplot found in Figure 2-1, below.
9 Notice that the dots tend to lay in a path that goes from the upper left area of the scatterplot to the lower right portion of the scatterplot. What type of relationship does this seem to indicate? How strong does the relationship seem to be? The scatterplot in Figure 2-1 indicates that there is a negative relationship between Time With Company and Hourly Pay . This means that the longer an individual has been employed with the company, the less they tend to be paid a very strange finding! Note that this does not mean that Time With Company actually causes lower compensation ( Correlation does not equal causation) it only shows that there is a relationship between the two variables and that the variable tends to be negative in nature.
10 Important Note: Correlation does not equal causation . To be correlated only means that two variables are related. You cannot say that one of them causes the other. Correlation tells you that as one variable changes, the other seems to change in a predictable way. If you want to show that one variable actually causes changes in another variable, you need to use a different kind of statistic which you will learn about later in this book. You should also be able to see that the negative relationship between Time With Company and Comensation seems to be pretty strong.