Transcription of The Easy Guide to: Inductively Coupled Plasma- Mass ...
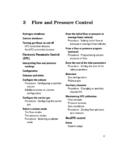
1 The Easy Guide to: Inductively Coupled plasma - mass spectrometry (ICP-MS) By Arianne Bazilio & Jacob Weinrich December 2012 Contents Introduction .. 2 Sample Introduction .. 3 Torch .. 4 Interface .. 6 mass spectrometry .. 7 ICP-MS User Guide .. 9 Works Cited .. 11 2 Introduction Inductively Coupled Plasma- mass spectrometry (ICP-MS) is a powerful tool for analyzing trace metals in environmental samples. A large range of elements can be detected using an ICP-MS, which are summarized in Figure 1 below. Figure 1. Elements detectable by ICP-MS analysis (Perkin-Elmer) The ICP-MS system can quantitatively measure the colored elements in Figure 1, and give a measurement of the total amount of the specific element of interest. The benefits of using plasma compared to other ionization methods, such as flame ionization, are that ionization occurs in a chemically inert environment, preventing oxide formation, and ionization is more complete.
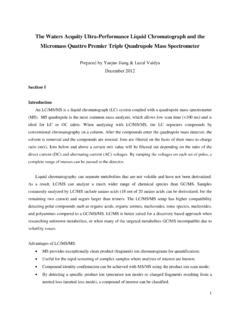
2 Also, the temperature profile of the torch is relatively uniform, reducing self-absorption effects. Linear calibration curves are observed over several orders of magnitude for ionization processes. The mechanisms in which ICP-MS analysis occur will be discussed in further detail. The process can be broken down into four stages; sample introduction, ICP torch, interface, and MS. 3 Sample Introduction The first step in ICP-MS is sample introduction. There are multiple ways in which a sample can be introduced, and the method of introduction depends on the physical characteristics of the sample. The various methods of sample entry are shown in Figure 2. While each method may be fundamentally different, they have the same goal: to sweep the sample of interest into the ICP torch in a gaseous or aerosol form for analysis. Figure 2. Potential sample entry pathways. (Skoog, Holler, and Crounch 2007) Typically, samples requiring ICP-MS analysis are in a liquid form.
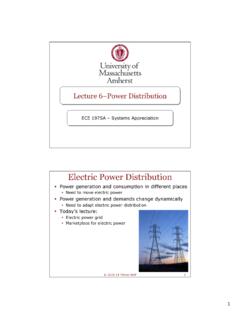
3 However, the samples must be introduced to the torch in either a gaseous form or an aerosol form. Therefore, liquid samples require sample nebulization, seen in Figure 3. The liquid sample is pumped from a vial, via a peristaltic pump, into the nebulizer. Liquid droplets are formed on the tip of a needle, where they become nebulized due to argon gas flowing through a second needle perpendicular to the sample needle. A small amount of aerosol created is swept into the torch, but the majority of sample condenses on the walls of the nebulizer and is wasted to the drain. 4 Figure 3. Schematic of liquid sample introduction to torch. (Skoog, Holler, and Crouch 2007) If a solid sample requires analysis, the most likely method of introduction would be via electrothermal vaporization. An electrothermal vaporizer uses electric current to rapidly vaporize a solid sample, which can then be swept into the ICP torch via argon gas flow. One fundamental aspect of ICP-MS analysis, which can be viewed as both a strength and weakness, is that elements are detected and quantified in total.
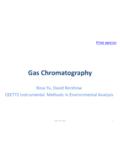
4 In other words, no separation of compounds containing the element of interest occurs. However, prior separation can occur via a chromatographic technique, such as gas chromatography, supercritical fluid chromatography, or liquid chromatography. Because gas and supercritical fluid chromatography separates samples in the gas phase, the eluents produced after column separation can be directly swept into the ICP-MS torch. However, liquid chromatography elutes, being in a liquid phase, require nebulization similar to that of standard liquid sample introduction. Torch The ICP torch consists of a copper induction coil wrapped around a concentric quartz structure, a schematic of which can be seen in Figure 4. 5 Figure 4. ICP torch schematic. (Skoog, Holler, and Crouch 2007) Argon gas is continuously flowing throughout the quartz torch, and a radio-frequency (RF) generator provides power to the RF coil at oscillating frequencies. plasma (an electrical conducting gaseous mixture) generation occurs when the argon gas is seeded with a spark from a Tesla unit.
5 The spark ionizes some of the argon, and the cations and electrons produced from that accelerate towards the RF coil. The cations and electrons collide with other argon molecules during this acceleration, creating high temperatures. With ample argon supplied, the plasma will reach equilibrium and remain at a constant temperature of about 6,000 C for the duration of analysis. The aerosol produced via nebulization enters this high temperature plasma , where it is first dried to a solid, and then heated to a gas, referred to as atomization. These atoms will continue to travel through the plasma , absorbing energy until they release an electron, becoming ionized, referred to as ionization. These newly formed ions then travel out of the torch and come to the interface. 6 Interface Generally speaking, the interface can be described as the point at which sample from the ICP portion of the instrument is introduced to the mass spectrometry (MS) portion of the instrument.
6 The interface portion of the instrument serves to allow the ICP and MS portions to be Coupled . A general schematic of this interface can be seen in Figure 5. Figure 5. General schematic of interface. (Skoog, Holler, and Crouch 2007) The first component the sample matrix confronts after ionization in the ICP torch is the sampler cone. This is a water cooled cone with a small orifice, allowing for the hot plasma gas to enter a depressurizing chamber. In this chamber, rapid cooling, and thus rapid expansion, of the gas occurs. A fraction of this gas then passes through a skimmer cone, and into a chamber that is maintained at a vacuum of that of the MS. This two-step pressure reduction allows the ionic gas to enter the MS at proper temperature and pressure. 7 mass spectrometry After passing through the sample and skimmer cones, the ion stream is focused into the quadrupole region by single ion lenses. Ions generated in plasma are nearly all positively charged and have a tendency to repel each other.
7 The ions pass through a charged metallic cylinder which keeps the ion beam from diverging. The Elan DRC-e ICP-MS is equipped with a dynamic reaction cell (DRC). The DRC is located in the vacuum chamber between the lens and the quadruple. Chemical modification of the ion beam to eliminate interferences occurs in the DRC when operating in DRC mode. The type of reaction gas and pressure is set by the user in the computer software. Interference is prevented by interrupting the sequence of reactions that would otherwise create interference. When DRC mode is off, the DRC is a multipole device which transfers the ions to the MS analyzer chamber. mass spectrometry is used to provide information about the elemental composition of samples of matter; the structures of inorganic, organic, and biological molecules; the qualitative and quantitative composition of complex mixtures; the structure and composition of solid surfaces; and isotopic ratios of atoms in samples.
8 Energetic electrons collide with analyte molecules and impart enough energy to leave the molecules in an excited state. Relaxation then often occurs by fragmentation of part of the molecular ions to produce ions of lower masses. Ions are dispersed in the mass analyzer based on their mass -to-charge ratio (m/z). mass spectrometers require low pressures in all of the instrument components except the signal processor and readout. The capability of a mass spectrometer to differentiate between masses is usually stated in terms of its resolution which is defined by Equation 1: Equation 1 In the equation, is the mass difference between two adjacent peaks that are just resolved, and m is the nominal mass of the first peak. 8 Figure 6. A quadrupole mass spectrometer (Skoog, Holler, and Crouch, 2007) The quadrupole mass spectrometer (Figure 6) is the most common type of mass spectrometer used in atomic mass spectroscopy.
9 Four parallel cylindrical rods serve as electrodes; opposite rods are connected electrically with one pair connected to the positive side of a variable direct current (dc) source, and the other to the negative terminal. Variable radio-frequency alternating current (ac) voltages 180 out of phase are applied to each pair of rods. Ions are accelerated into the space between the rods by a potential of 5 to 10 V while the ac and dc voltage son the rods are increased simultaneously but with a constant ratio. The quadrupole is a mass filter which only allows ions having a limited range of m/z values reach the transducer. Ions that are not of the correct m/z collide with the rods or exit the path between the rods and are pumped out of the system. Quadrupole instruments easily resolve ions that differ in mass by one unit. The MS in the Elan DRC-e scans the mass range from 5 to 270 amu in milliseconds. Ions that exit the mass analyzer enter the detector.
10 The Elan DRC-e is equipped with a dual mode detector. The ions exiting the quadrupole produce an amplified signal that is processed by the detection electronics and sent to the computer for data processing. The detector is comprised of 26 dynodes. The ions exiting the MS strike the active surface of the first angled dynode. This allows the ions to follow a curved path, separating the signal ions from the background noise (neutral and radiation from the ion source). The dynode releases an electron each time an ion strikes it. The electrons released from the first dynode strike the second dynode and more electrons are released. Cascading of electrons continues until measurable pulse is created. A counting pulse system counts ions that first hit the dynode. If the pulse count exceeds about 2 x 10⁶ counts, an isolated dynode is switched to ground potential, disabling the pulse section of the detector.