Transcription of The Economic Impacts and Macroeconomic Benefits of …
1 The Economic Impacts and Macroeconomic Benefits of energy efficiency Programs in Oregon ECON orthwest )'3231-'7 *-2%2') 40%22-2+. Robert Whelan, Tessa Krebs, and Tina Morgan prepared this report. ECON orthwest is solely responsible for its content. Cover photo at center courtesy of Diana Rothery; right cover photo courtesy of Nate Watters. ECON orthwest specializes in economics, planning, and finance. Established in 1974, ECON orthwest has over three decades of experience helping clients make sound decisions based on rigorous Economic , planning and financial analysis. For more information about ECON orthwest, visit our website at For more information about this report, please contact: Robert Whelan ECON orthwest 222 SW Columbia Street Portland, OR 97201. 503-222-6060. TABLE OF CONTENTS. TABLE OF CONTENTS. 1 Executive Summary 5 Background 7 macroeconomics of energy efficiency Programs 11 Conclusion: Macroeconomic Effects of energy efficiency 12 Economic impact Analysis 18 Appendix: Detailed Economic impact Tables THE Economic Impacts AND Macroeconomic Benefits OF energy efficiency PROGRAMS IN OREGON.
2 EXECUTIVE SUMMARY. EXECUTIVE SUMMARY. This report, sponsored by member companies of the Northwest energy efficiency Council (NEEC). and written by ECON orthwest, describes the Economic effects of energy conservation work done in Oregon. NEEC members provide products and services that improve energy efficiency . Traditionally, Economic impact reports on energy efficiency programs have narrow focuses. They all consider the Impacts of spending on energy efficiency products and services . Those are Impacts limited to one year and within one state. Some reports go further. Since utility customers enjoy lower utility bills in the years following in the implementation of energy efficiency measures and practices, they have more money to spend each year and this causes Economic Impacts . Rarely addressed, however, are the long-run Macroeconomic effects arising from productivity growth. Our economy produces goods and services by using factor inputs.
3 These inputs include labor, capital, raw materials, and energy . Becoming more productive means society produces more output with the same amount predicts how improving energy efficiency over the effects an average year of investment in Oregon of factor inputs. Making our state more energy long run would play out. The direction and types on energy efficiency products and services has efficient increases productivity growth. of Benefits are clear, but accurately quantifying on the state's economy. Productivity growth is the cornerstone of long-run beyond broad estimates of magnitude would be It then looks at the useful, though less common Economic health. It also affects our competitive an exercise in unprovable speculation. Therefore, perspective, of how one year of investment saves position. The more productive Oregon is, the ECON orthwest begins with a logical, albeit largely consumers money on their utility bills.
4 Specifically, better it competes in national and world markets. qualitative discussion of the Macroeconomic how they spend those savings and what the In short, productivity growth is the source of a Benefits of improving energy efficiency in Oregon. Economic Impacts of that spending are. higher standard of living. The report then turns to the standard view that Our analysis reports values in 2012 dollars, which This report addresses the Macroeconomic other states consider when looking at the Impacts is also the base year for the Economic impact effects qualitatively, as there is no credible of energy efficiency investments. We use an model and its data. NEEC asked that the analysis Macroeconomic model of Oregon that reliably Economic impact analysis, which tells us what consider an average year and provided data for THE Economic Impacts AND Macroeconomic Benefits OF energy efficiency PROGRAMS IN OREGON | 1.
5 2008 through That is five years of spending Figure 1. by utilities and utility customers on energy efficiency products and services . ECON orthwest adjusted that data for inflation, converting values to 2012 dollars. We refer to this as the average year of investment spending. Macroeconomic Effects Making businesses and households more energy efficient causes Macroeconomic effects. Unlike Economic Impacts , which focus on spending passed along the supply chain, Macroeconomic effects are more broadly felt and are the third effect analyzed by ECON orthwest. Better efficiency means that Oregon's economy can produce more goods and services with less energy and at lower costs. Over time, the cumulative investments in energy efficiency can raise the overall productivity of the economy. This improves Economic welfare and elevates the standard of living of Oregon residents. Higher incomes, more jobs, and better quality of life are among the potential results.
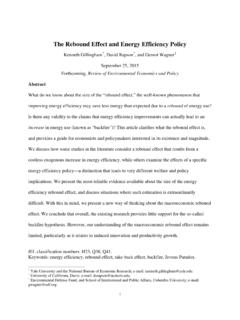
6 Historically, energy use has kept pace with the economy. A recent analysis by the Department of energy , illustrated in Figure 1, shows the tight connection between the nation's gross domestic product ( GDP ) and energy consumption. The GDP is the value of the domestic production of divergence widened considerably after 2000, as effects in a qualitative manner, although, a review goods and services . TThat relationship between GDP grew while energy consumption did not. of the experience in the 1970s and 1980s energy use and GDP was close from 1950 to the Predicting the degree of future Macroeconomic suggests, increased energy efficiency leads to mid 1970s. Then, sharply higher oil prices drove improvements is a matter of great uncertainty. increased productivity growth and a significant conservation and energy use and GDP began to As any long-term forecast, the range of possible rise in Economic wellbeing.
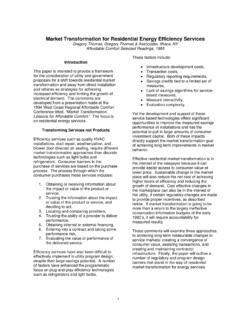
7 Diverge. But since then, the adoption of improved outcomes is too wide. Therefore, rather than The Macroeconomic effects of energy efficiency energy efficiency technologies, leading to placing numbers on it that are purely speculative, and energy production are discussed beginning productivity gains, have caused Macroeconomic ECON orthwest discusses Macroeconomic on page 7. effects leading to higher GDP growth. The 1. Total installation spending statewide in 2012 was within one percent of the 2008 2012 average. However, spending on specific subsectors of the economy fluctuate, so that taking a multi-year average produces a more reliable assessment of normal conditions. 2 | ECON orthwest EXECUTIVE SUMMARY. Economic Impacts of energy efficiency Figure 2. Investments In the average year, over a quarter of a billion In the baseline scenario, $ million was spent in Oregon dollars is invested in energy efficiency products and services within Oregon State.
8 The gross on energy - efficiency improvements. impact of that spending reverberates throughout the economy affecting jobs, income, and output. What were the gross, alternative, and net Impacts ? About $ million of Oregon's gross regional product ( GRP ) is linked to energy efficiency Importantly, so too were 4,931 jobs Gross Minus the Equals the Net in the state. Those jobs generated $ million Impacts Alternative* impact : in labor income. But how much extra GRP and how many more jobs were there in Oregon because of the investments? For that, the analysis subtracts the alternative 4,931 - 2,498 = 2,433. case. That is what would have happened had people and businesses not spent the quarter JOBS. billion dollars on energy efficiency . Had no money $. been spent on efficiency measures, some of that money would have been spent elsewhere in Oregon on other goods and services , and that $ - $ = $ spending would have had Economic Impacts .
9 LABOR INCOME. Subtracting the alternative from the gross Impacts gives us net Impacts . That is the net difference energy efficiency spending had on Oregon in the average year. $ - $ = $ Figure 2 illustrates the calculation of net Economic GDP. Impacts . In the average recent year, there were GRP. on net 2,433 more jobs in Oregon because *The Alternative refers to what happens if the money that went toward energy efficiency was spent elsewhere. of energy efficiency investments. They had a net impact of $ million in additional labor income throughout Oregon. The state's GRP was The net Impacts of installation are positive and Oregon. Therefore, the gross Impacts are large. $ million higher as a result. All of these are substantial for good reasons. Essentially, nearly In comparison, general spending, especially by summarized further on page 13 and the first of all installation spending occurs inside Oregon and businesses, is more likely to involve out-of-state several detailed tables of installation Impacts is local-labor intensive.
10 The subsequent rounds purchases. There is more leakage. The local appear on page 18. of spending and employment stay mostly within Impacts are less, so the spending Impacts of 2. GRP is the aggregate value of all the domestic production of goods and services done within a region or a state. GDP is the national equivalent for this measure. THE Economic Impacts AND Macroeconomic Benefits OF energy efficiency PROGRAMS IN OREGON | 3. installation work are a net positive. In addition to Figure 3. the analysis of actual installation spending data, NEEC asked ECON orthwest what the Impacts would be if 50 percent more was spent on energy What were the gross, alternative, and net Impacts of lowering efficiency products and services in the baseline year? We also calculated the Impacts and they annual utility bills by $ million? appear on page 17. energy Bill Savings The second impact effect that ECON orthwest Gross impact Minus the Equals the Net of consumers spending their measured arises from the savings on utility bills utility bill savings Alternative* impact : in the years after 2012.