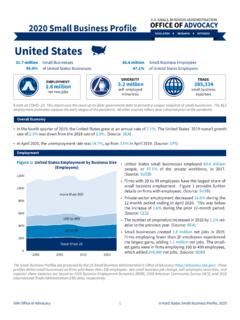
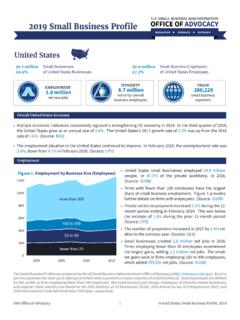
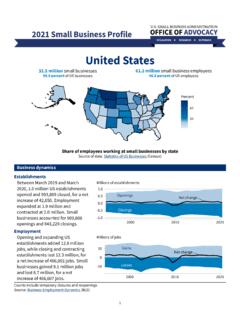
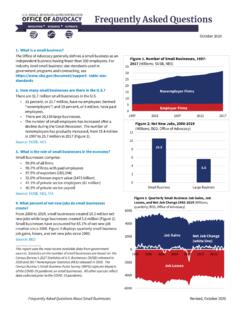
Transcription of The Effects of the COVID-19 Pandemic on Small Businesses
1 Issue Small BUSINESS ADMINISTRATIONI ssue BrIef NumBer 16release Date: march 2021 The Effects of the COVID-19 Pandemic on Small BusinessesDaNIel WIlmoth, research ecoNomIstoffIce of aDvocacy, Small BusINess aDmINIstratIoNIn March 2020, the COVID-19 Pandemic arrived in the United States. Along with illness and death, the Pandemic brought widespread economic disruption. Businesses closed and unemployment surged to levels not seen since the Great Depression. As Figure 1 shows, the number of people who were self-employed and working was 20 percent lower in April 2020 than in April issue brief shows the Effects of the COVID-19 Pandemic on Small Businesses . While economic damage was widespread, the severity varied substantially across locations, industries, and demographic categories. Locations with larger declines included metropolitan and coastal areas. Industries with larger declines included restaurants and taxi and limousine services.
2 Differences by location and industry contributed to differences across demographic categories, with larger declines for Asian and Black business , methods, and limitationsMany popular sources of data on Small Businesses are released months or years after the periods they describe. To provide an account of recent developments, this issue brief relies primarily on employment Office of Advocacy Brief Number 16 Page 2 Release Date March 2021data. Data on total employment by industry are available through the Current Employment Statistics (CES) program and are combined here with 2017 data on the business size composition of industries from the Statistics of US Businesses (SUSB). Data on employment, location, industry, and demographic category are available through the Current Population Survey (CPS). The CPS data analyzed here were accessed through One variable in the data indicates if individuals were self-employed in their most recent job, while a second variable indicates if individuals were still working at the time of the survey.
3 Business owners who closed their Businesses were recorded as self-employed but not working if they had not obtained other employment or as no longer self-employed if they had obtained a wage or salary position. Changes over time in the number of people working and self-employed reflect declines from temporary closure and business deaths and increases from reopening and business CPS data provide detailed descriptions of respondents that can be used to analyze specific groups, such as self-employed individuals living in a particular metropolitan area. However, as the groups become more specific, the samples become smaller, and the statistics noisier. Sample size was considered in decisions about what statistics to present. However, the statistics presented still represent a wide range of sample sizes, and the statistics representing less specific groups, such as the self-employed in all metropolitan areas, are more precise than the statistics representing more specific groups, such the self-employed in the New York City 2 shows changes in the number of working self-employed people living inside and outside metropolitan areas.
4 In April 2020, the number of people in metropolitan areas who were working and self-employed was 21 percent lower than in April 2019. Outside of those areas, the decline was only 13 percent. In subsequent months, the decline in metropolitan areas continued to exceed the decline outside of metropolitan Flood, S., Miriam King, Renae Rodgers, Steven Ruggles and J. Robert Warren, Integrated Public Use Microdata Series, Current Population Survey: Version Minneapolis, MN: IPUMS, 2020. Office of Advocacy Brief Number 16 Page 3 Release Date March 2021 Figure 3 shows declines for the three largest metropolitan areas in the United States. The New York City area experienced a decline of 44 percent in April 2020. The Los Angeles area did not reach its nadir until July 2020, with a decline of 36 percent. Like the New York City area, the Chicago area reached its nadir in April 2020, but with a decline of only 16 variations across metropolitan areas in Figure 3 reflect variations across regions.
5 As Figure 4 shows, the decline was most severe in the Northeast, substantial in the South and West, and least severe in the Midwest. However, the declines for each of the large metropolitan areas in Figure 3 exceed the declines for the surrounding CES program reports total employment by industry supersector. Each disc in Figure 5 corresponds to a different supersector. The vertical axis shows changes in supersector employment between April 2019 and April 2020. The horizontal axis shows the share of employment by Small Businesses before Office of Advocacy Brief Number 16 Page 4 Release Date March 2021the Pandemic . The size of each disc corresponds the supersector share of total employment before the with large shares of employment at Small Businesses before the Pandemic experienced large decreases in employment. Leisure and hospitality had the largest decrease in employment, at 48 percent, and had the third largest Small business share, at 61 percent.
6 Miscellaneous services had the largest Small business share, at 85 percent, and the third largest decrease in employment, at 22 6 shows a decomposition of the leisure and hospitality supersector into subsectors. The largest subsectors were accommodation, accounting for 13 percent of supersector employment, and food services and drinking places, accounting for 73 percent. Food services and drinking places had a high share of employment at Small Businesses , at 64 percent, and a large decrease in employment, at 48 percent. Although the initial employment decline for food services and drinking places was larger than the decline for accomodation, food services and drinking places recovered more quickly than other leisure and hospitality subsectors. Figure 7 shows that by November 2020 the decline for food services and Office of Advocacy Brief Number 16 Page 5 Release Date March 2021drinking places remained substantial, at 16 percent, but was significantly smaller than the decline for accomodation, at 32 demographicsFigure 8 shows variation across demographic groups in the Effects of the Pandemic on the self-employed.
7 The total number of people who were self-employed and working declined by percent between April 2019 and April 2020. The Hispanic group experienced a higher decline, at percent. The highest declines were experienced by the Asian and Black groups, with a decline of percent for the Asian group and percent for the Black 9 shows how changes in the number of people self-employed and working varied over time for the Asian group, the Black group, and everyone else. In the months following April 2020, impacts continued to be larger for the Asian and Black groups. However, all three categories began to recover, and Office of Advocacy Brief Number 16 Page 6 Release Date March 2021differences across the groups generally decreased. The series for the Asian and Black groups are derived from smaller samples and therefore include more random across demographic groups in the Effects of the Pandemic reflect the distributions of groups across places.
8 Asian and Black business owners were more highly concentrated in places with larger declines. Before the Pandemic , eight percent of the self-employed in metropolitan areas were Asian, and eight percent were Black. Outside of metropolitan areas, one percent were Asian, and two percent were Black. Table 1 shows several large metropolitan areas with severe declines and high concentrations of Asian or Black business owners. Areas with severe declines and high concentrations of Asian owners included Los Angeles, New York, and San Francisco. Areas with severe declines and high concentrations of Black owners included Philadelphia, San Francisco, and Washington, DC. Office of Advocacy Brief Number 16 Page 7 Release Date March 2021 Differences across demographic groups in the Effects of the Pandemic also reflect the distribution of groups across industries. Asian and Black business owners were more highly concentrated in industries with larger declines.
9 Table 2 shows several industries with severe declines and high concentrations of Asian or Black business owners. Industries with severe declines and high concentrations of Asian owners included restaurants and specialized design services. Industries with severe declines and high concentrations of Black owners included child daycare services and taxi and limousine patterns in Tables 1 and 2 are related, because industry composition varies across locations. All of the industries in Table 2 are concentrated in metropolitan analysis provides an early and partial account of the Effects of the COVID-19 Pandemic on Small Businesses . Changes in the number of people who are self-employed and working reveal closures but do not reveal which closures will become permanent. Data on self-employment provide only a partial account of business activity. In the months and years to come, the release of additional data will enable further Effects of the COVID-19 Pandemic are ongoing.
10 While some Businesses have largely recovered from the initial decline, others continue to lag, and some recovered only to experience subsequent declines. Future impacts of the Pandemic , including whether business closures become permanent, will depend in part on policy responses. The federal response has already included $525 billion3 in emergency funds extended through the Paycheck Protection Program and $194 billion4 through the Economic Injury Disaster Loan program, with an additional $284 billion5 in Paycheck Protection Program funds For further analysis, see Fairlie, Robert W., The Impact of COVID-19 on Small Business Owners: Continued Losses the Partial Rebound in May 2020. NBER Working Paper 27462, July 2020. 3 US Small Business Administration, Paycheck Protection Program (PPP) Report. August 8, US Small Business Administration, Disaster Assistance Update Nationwide EIDL Loans. November 23, US Small Business Administration, SBA and Treasury Announce PPP Re-Opening; Issue New Guidance.