Transcription of The Growing Debt Burden for Canadians: 2021 Edition
1 FRASER RESEARCH BULLETIN 1 FRASER RESEARCHBULLETINF ebruary 2021 Budget deficits and increasing debt have become serious fiscal challenges facing the federal and many provincial governments re-cently. Since 2007/08, combined federal and provincial net debt (inflation-adjusted) has doubled from $ trillion to a projected $ trillion in 2020/21. In 2020/21, combined federal and provincial net debt is expected to equal of the Ca-nadian economy, up from last year. Among the provinces, Nova Scotia has the highest combined federal-provincial debt -to-GDP ratio ( ), while Alberta has the low-est ( ). Newfoundland & Labrador has the highest combined debt per person ($64,224), closely followed by Ontario ($58,559).
2 In con-trast, British Columbia has the lowest debt per person in the country with $43,635. Interest payments are a major consequence of debt accumulation. Governments must make interest payments on their debt similar to households that must pay interest on bor-rowing related to mortgages, vehicles, or credit card spending. Revenues directed towards in-terest payments mean that in the future there will be less money available for tax cuts or gov-ernment programs such as health care, educa-tion, and social services. Post-COVID, the federal and provincial governments must develop long-term plans to meaningfully address the Growing debt prob-lem in Jake Fuss and Steve LafleurThe Growing debt Burden for Canadians: 2021 Edition The Growing debt Burden for Canadians: 2021 FRASER RESEARCH BULLETIN 2government ran deficits in either 2008/09 or 2009/10.
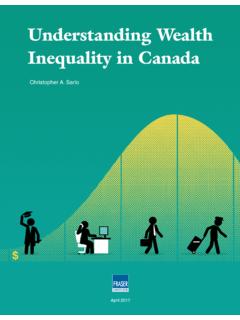
3 In subsequent years, Growing debt and persistent deficits again became the norm for the federal and provincial governments. Figure 1 demonstrates how combined fed-eral and provincial net debt has evolved since 2007/08. Notably, data indicate that total net debt will likely reach over $ trillion in 2020/21. The growth in government debt is not limit-ed to only a few provinces or one level of gov-ernment. Real debt levels have risen federally and in every province between 2007/08 and 2020/21. Table 1 displays the change in net debt (inflation-adjusted) for the federal and provin-cial governments during these years. In just over a decade, combined federal and provincial debt has grown by $ billion, or Over these 13 years, federal net debt has in-creased by $ billion (in 2020 dollars), or This stands in stark contrast to the pe-riod between 1996/97 and 2007/08 when the federal government reduced its net debt (in 2020 dollars) by $ billion.
4 Put differently, in the past 13 years the federal government has accumulated nearly double the amount of debt that it repaid in the mid-1990s to late-2000s. Among the provinces, Alberta experienced the largest percentage increase in its debt level at For an extended period Alberta has consistently increased real program spending and has run nearly uninterrupted deficits since 2008/09 regardless of the state of the In fact, Alberta has moved from being the only province in a net financial asset position in 2 Eisen et al. (2019) found that Alberta s per-person program spending was substantially higher than in comparable provinces like British Columbia, On-tario, and Quebec.
5 In 2018/19, for instance, Alberta IntroductionBudget deficits and the growth of government debt have recently re-emerged as key fiscal challenges facing canadian governments. debt has risen significantly for the federal and pro-vincial governments since the 2008/09 reces-sion, but there was a particularly sharp spike in debt levels in 2020 due to the COVID-19 pan-demic. Provinces such as Alberta, Manitoba, and Ontario have not balanced their books in years, while Ottawa has chosen to consistent-ly run deficits since the onset of the global fi-nancial crisis more than a decade ago. Overall net debt1 for the federal and all 10 provincial gov-ernments is projected to grow substantially in 2020/21, which will pose significant problems for Canadians and our public finances in the future.
6 This research bulletin examines the growth of government debt in Canada since the 2008/09 recession, illustrates the differences among the provinces, and quantifies the Burden of govern-ment debt currently held by canadian citizens. Accumulation of government debtOver the past 13 years, government debt across Canada has been Growing quickly. This accumu-lation of debt has reversed a positive trend to-wards balanced budgets and lower debt burdens that prevailed from the mid-1990s to the late-2000s at both the federal and provincial levels. This trend more or less lasted until 2007/08. Combined federal and provincial net debt to-taled $ trillion that year (in 2020 dollars).
7 However, the 2008/09 recession brought this trend to a halt. Government spending increased dramatically in 2009/10 and every canadian 1 Throughout this bulletin, the authors refer to debt as net debt , which is defined as financial assets minus total Growing debt Burden for Canadians: 2021 FRASER RESEARCH BULLETIN 3 Figure 1: Combined Federal and Provincial Net debt (in billions of 2020 dollars), 2007/08 to 2020/21 Notes:(i) debt levels for 2020/21 are based on the latest government projections available at the time of writing.(ii) Net debt is presented on a consolidated basis in each : Canada, Department of Finance (2020a and 2020b); Alberta, Ministry of Finance (2020); British Columbia, Ministry of Finance (2020); Saskatchewan, Ministry of Finance (2020); Manitoba, Ministry of Finance (2020a and 2020b); Ontario, Ministry of Finance (2020); Qu bec, Minist re des Finances (2020); Newfoundland, Department of Finance (2020); New Brunswick, Department of Finance (2020); Nova Scotia, Department of Finance (2020); Prince Edward Island, Department of Finance (2020a and 2020b); Statistics Canada (2020c).
8 2007/08 to a province with the fastest grow-ing debt Burden today. Other provinces such as British Columbia, Saskatchewan, Manitoba, and Ontario have all increased their debt levels by more than 100% as well. This sizeable growth in provincial debt is an im-portant development for the future of Canada s spent $12,622 per person, which is higher than the $10,647 spent in British Columbia. public finances. While the federal government has increased its debt level, the provinces have been increasing their debt levels at a much faster rate. Figure 2 shows that the portion of total net debt held by the federal and provin-cial governments has shifted substantially over time.
9 For example, the federal portion of total government debt shrunk from in 2007/08 to as low as in 2018/19. However, this trend of shifting debt burdens was halted, at least temporarily, in 2020 as the federal gov-1,0282,00902505007501,0001,2501,5001 ,7502,0002,2502007/082009/102011/122013/ 142015/162017/182019/20 Billions of 2020 dollarsThe Growing debt Burden for Canadians: 2021 FRASER RESEARCH BULLETIN 4 Table 1: Federal and Provincial Net debt (in billions of 2020 dollars), 2007/08 Compared to 2020/21 Net debt 2007/08 Net debt 2020/21 Change ($ billions)Change (%) , + , : Figure 1; calculations by took on considerably more debt than its provincial counterparts in response to CO-VID-19.
10 Indeed, the federal portion of total gov-ernment debt has grown approximately 6 per-centage points this year to reach of debtGovernment debt is commonly measured based on its share of the economy using gross do-mestic product (GDP). The debt -to-GDP ratio is a useful way to compare government debt between different jurisdictions and evaluate the sustainability of government debt accumu-lation. Figure 3 shows federal, provincial, and combined federal-provincial net debt as a share of the economy in 2007/08 and 2020/21. The federal net debt -to-GDP ratio has grown from to over this period. Growth in debt as a share of the economy was not lim-ited to the federal government during this pe-riod.