Transcription of The Importance of Particle Size Distributions to …
1 The Importance of Particle size Distributions to The characterization of SoilsAndy Ward, Institute for Meteorology and HydrologyOctober 25, 2012 AcknowledgmentsThe Department of Energy for funding through the Remediation and Closure Science and Science Focus Area Draper, formerly of the Pacific Northwest National lab, who performed most of the measurements as part of her researchGary Rawson, Technologies North America Inc, perhaps the only sales person I have ever trustedBackgroundReliable prediction of multi-scale transport behavior needed to support: Environmental remediationEngineered waste repositoriesGeologic sequestrationOil and gas productionWater resources managementA critical need for all application areas is reliable estimation of model parameters, particularly flow and transport propertiesMajor ChallengeRocks, soils and sediments are naturally heterogeneousKnown to control near-surface and subsurface contaminant Distributions Knowledge of flow and transport (energy, mass) properties and how they vary in space (and time) to:Interpret current contaminant distributionspredict future contaminant migrationManage soil and water resources under changing climateTypical StratificationAtypical StratificationParticle size distribution Transcends all ScalesIce-Age flood deposits in the southern Pasco Basin6 Effects Manifested at Multiple ScalesWhy Measure Particle size Distributions ?
2 Particle size is a fundamental property of any sediment, soil or dust deposit can provide important clues to nature and provenanceIt influences a variety of other propertiesCan be defined across a hierarchy of scalesStratigraphic ArchitectureSedimentary SequencesLithofaciesSmall-scale heterogeneitiesParticle size DistributionsProperties estimated from texture cannot explain transport behaviorMeasured PSDs mostly multi-modal size fractions Gravel coatingsRarely log normalMore realistic and unique description using size statisticsmean diametersorting coefficientmust account for gravelBouldersPebblesVery coarseCoarseMediumFineVery fineSandVery coarseCoarseMediumFineVery fineSiltVery coarseCoarseMediumFineVery fineClayParticle size ClassesPrimary sediment properties are controlled by facies Distributions , which in turn are controlled by grain size Distributions resulting from the depositional environment Reactive PropertiesSpecific surface areaCECporSporReaction KineticsThermal PropertiesHeat CapacityThermal conductivityElectrical PropertiesDielectric SpectroscopySurface conductivityFormation FactorChargeabilityTransport PropertiesTortuosityIntrinsic PermeabilityDispersivityFormation FactorParticle size DistributionNatural Isotope Abundance 40K, 238U, 232 ThGross -ray responseHydraulic PropertiesBulk densityPorosityResidual water contentWater retentionRelative PermeabilityProperties Dependent on Particle SizeCharacterization of Primary ParticlesTraditional characterization of size of individual particles by.
3 SievingSedimentationSoil whose mineral phase is to be characterized isPretreated to remove organic matterTreated to disperse aggregatesPassed through series of sieves with specified openings (smallest is mm)Sizes of remaining dispersed separates characterized indirectly by sedimentation (based on Stokes Law)Challenges in Estimating PropertiesProperties estimated from traditional PSDs often do not explain transport behaviorPSDs typically multi-modalFractions NOT log normalCoatings that affect sorptionRobust relationships demands a higher level of characterization whole sedimentssize fractionscoatings Particle size distribution 1 10 100 1000 3000 Particle size ( m)0 1 2 3 4 5 Volume (%)C6216/2-29 39'-41' 32mm (Pre sonic) - Average, Thursday, January 08, 2009 3:19:48 PMC6216/2-29 39'-41' 32mm (10min sonic) - Average, Thursday, January 08, 2009 3:46:33 PMC6216/2-29 39'-41' 32mm (Post sonic) - Average, Thursday, January 08, 2009 3:50.
4 32 PM0%10%20%30%40%50%60%70%80%90%100%Perce nt PassingSize (mm)C5213 3-30 '-8'C6216 2-29 39'-41'C6213 '-5'C6212 2-28 47'-49'C6216 2-29 30-33 siltclay2 m50 mParticle size of Coatings on 32 mm GravelParadigm ShiftIdentifying such relationships requires a higher level of sediment characterizationWhole sedimentsSize fractionsMeasure Particle size distributionsMeasure Physico-chemical propertiesCEC, SA, etcCharacterize mineralogy Mass Fraction, xij, of size class and LithocomponentsHeterogeneousSedimentGrai n size ClassesLithocomponentsMass Fraction of LithocomponentsGrainSub-classesx1,1x2,1x 3,1x4,1x5,1 Sievingx1,2x2,2x3,2x4,2x5,2x1,3x2,3x3,3x 4,3x5,3x1,4x2,4x3,4x4,4x5,4 Mass Fraction, xij, of size class and LithocomponentsHeterogeneousSedimentGrai n size ClassesLithocomponentsMass Fraction of LithocomponentsGrainSub-classesx1,1x2,1x 3,1x4,1x5,1 Sievingx1,2x2,2x3,2x4,2x5,2x1,3x2,3x3,3x 4,3x5,3x1,4x2,4x3,4x4,4x5.
5 4 HeterogeneousSedimentGrain size ClassesLithocomponentsMass Fraction of LithocomponentsGrainSub-classesx1,1x2,1x 3,1x4,1x5,1 Sievingx1,2x2,2x3,2x4,2x5,2x1,3x2,3x3,3x 4,3x5,3x1,4x2,4x3,4x4,4x5,4 Conceptual Model for Polydiserse MaterialsSoils are linear systems that obey the additivity principleFor all linear systems F(x) = y, where x is a stimulus and y is a response, the superposition of stimuli yields a superposition of the respective responses:PSD of whole sample is then calculated from the Distributions of, , 2 components as: )()()(2121xFxFxxF2111)1(fpfpf Challenges to ApproachParticle Shape: Assumption of spherical shapeControls arrangement and packing thus mass-volume relationshipsIndividual property as fundamental as sizeSample SizeNeed PSD of very small samplesRequires precise determination using a rapid and reliable method with a high degree of precisionMineralogyAffect geochemical propertiesTransported aggregates are often polymineralicAccounting for MineralogyFigure : Mineralogy of Yukon River Sediment as a function of grain size for (a) fine material, and (b) coarse material (after Matthews, 2007).
6 Solution to Most of My ProblemsHoriba LA 950 Particle size AnalyzerWidest Range Available: mFastest sample analysis available60 seconds sample-to-sampleRapid change from wet to dry analysisFully automated, modular sampling systemsEasy and cheap to repair even when no technician available provided Home Depot is openMaterialsCoarse and fine fractionsSilt loam Accusand (. mm) Silica beads ( mm) Pebbles ( mm) Binary mixturesTriplicate samples10% increasing finesSolution-Solid ratio 2:1 Synthetic GroundwaterpH = [CO3] = 10-3mol L-1100 ppb U(VI)DesignContact times: , , , , 1, 2, 4, 8, 16, 32, 64, 128, 256 hrsSupernatant separation using 15 minute centrifugationSupernatant filtered ( m) and analyzed for U and pHKinetics9% Silt + 91% Marbles51% Silt + 49% MarblesPebble and Silt end membersSorption on Binary MixturesAccusand, Marbles, Silt, PebblesContact times: 24 hrs, 5 daysUranium Sorption ExperimentsOrbital shaker (116 rpm)Binary MixtureFine End MemberPebble End MemberCoarse End MemberAnalytical MethodsSolid PhaseContinuous Particle size distribution by laser diffractionSurface area measuredby N2gas adsorption Surface area calculatedby geometric method.
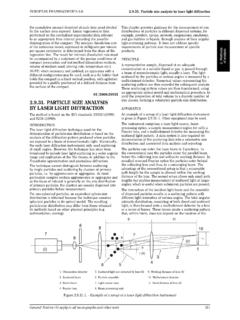
7 Surface topography and chemical composition by optical and scanning electron microscopy nnsiiiiiinsiiiiiiGEOlpdpSA11 QuantachromeAutosorb 6 BSurface Area and Pore size AnalyzerHoriba LA-950 laser diffraction analyzer Laboratory Studies with Model MixturesFigure 2. Post-sonication Laser Particle size distribution of Textures Based on USDA ClassificationHow Do we Use these Data? To Describe Particle size StatisticsFolk and Ward (1957) introduced the Graphic Method to estimate the various statistical parameters describing a grain size distribution using only percentiles taken from cumulative frequency50Md Median1650843M Standard deviation 5955059516845016842222 SkSkewness2575595( KKurtosis)1650843M Mean1. Determine 16, 50and 84 16 = 50 = 84 = = Example Calculation of the (mm)Clay Mass (mm)Silt Mass (mm)Sand Mass (mm)Mud Mass FractionTexture and Mean DiameterTo Understand Depositional EnvironmentsSamples collected from rivers and beaches (lake and ocean)Skewness plotted against Sorting CoefficientBeach sands better sorted and with more common coarse tail skewness than river sandsReflects difference in processes acting on rivers and beachesRivers carry wider range of sizes: large particles move in contact with bed; large volume of fine particles in suspensionPoorly sorted; rich in fine particles (+ve skewness).
8 Particle size and Water-Storage in AlluviumParticle size and PorosityTypical sediment made up of Spheres of different sizesSmall spheres can fill in pore throats formed by larger spheresResult is a lower porosity The porosity, b, of a multicomponent mixture may then be calculated as:1060) ( ),,;,,,;,,,(212121npppnbndddXXXf where Xiis the fractional solid volume of the ithcomponent. Porosity (m3 m-3)Predeicted Porosity (m3 m-3)Porosity Predicted from Particle size DistributionsParticle size and PermeabilityHydraulic Properties From Particle size DistributionsMicrostructure characterization grain parameters controlling Particle arrangement and packing Pore StructureIdentify individual particles and arrangementSimulate packingFeasibility established with simple case of binary mixture (coarse + fine)Extend binary fractional packing concept to the nfractions of the Udden-Wentworth Particle - size scaleRobust approach for upscaling basic parameters derived from grain size distributionsAllows correction for sizes > 2000 micronFines Content by Volume (%)0 min100 fGravel SupportedMatrix Supported cPorosityLinear mixtureDispersed mixtureFines Content by Volume (%)
9 0 min100 fGravel SupportedMatrix Supported cPorosityLinear mixtureDispersed mixtureIncomplete Mixing ConceptWater Rentention Curve with Unimodal Head(cm)Measured DataFitted (mm2) s(m3 m-3) Index050100150 ae (cm) b (g cm-3) Index01020 CEC (meq/100g)Fi = k = s = = BC = FI = ae = FI = b = + Ln(FI)R2 = = FI = Properties and TextureFacies Identifcation Particle size DistributionsIdentification of LithofaciesTh/K expresses relative K enrichment as indicator of clay mineral species and useful for distinguishing architectural elements ( Coarse vs. fine) grain parameters controlling Particle arrangement and packingy = = %Th (ppm)Identification of Lithofacies34 Multi-scale HeterogeneityTransect A-A Clay ContentSorption of Marbles AccusandAccusand and marbles are primarily silicaNo sorption expectedLow but non-zero sorption with standard high SEno change for fines < 40%Nonlinear after 40%Higher sorption in accusanddue to.
10 Rough surfacesmetal-oxide coatingsorganic sorbed ug/gMass Fraction of FinesSorption of Pebbles - Silt LoamLarge amount of U(VI) sorbed by pebblesInitial decrease in sorption on the addition of silt loamLikely blocks access to fractures on pebblesClassic v-shaped curve indicative of incomplete mixing Pebbles sorption inconsistent with current conceptual modelsnegligible surface areano contribution to sorptiongravel correction based on linear dilution (zero mixing) sorbed ug/gMass Fraction of FinesMarbles and Silt sorbed ug/gMass Fraction of FinesPartial Mixing ModelFines Content by Volume (%)0100 Gravel SupportedMatrix SupportedSorbed SpeciesIdeal MixingZero MixingIncomplete MixingcCminCfCSurface Area vs. size StatisticsSurface area measurements in mixtures show:nonmonotonic decrease with increasing D50decrease with geometric mean diameter, dgWell-behaved decrease as D10(measure of fines) increasesIncrease with sorting coefficientGeometric method assumes smooth spherical particles and not applicable to natural materials05101520251101001000 SABET (m2/g)Median Diameter, D50( m)(a) (m2/g)D10( m)(a)0510152025110100 SABET (m2/g)Sorting Coefficient, g(a)05101520251101001000 SABET (m2/g)Mean Diameter, dg( m)(a)Effects of Surface RoughnessA plot of SA(dg-1) should be linear intercept = internal SA, SAintSlope dependent on roughness, , exta/ Non-zero Interceptindicates SAint> 0inconsistent with the smooth, nonporous spherical Particle assumptionNonlinear relationshipSuggest that SAintand extboth dependent on dg (m2/g)dg 1 ( m 1)(a) (m2/g)dg 1( m 1)(b) (m2/g)dg 1( m 1)(d)