Transcription of The Inclusive Development Index 2018 Summary and Data ...
1 The Inclusive Development Index 2018 Summary and Data HighlightsSlow progress in living standards and widening inequality have contributed to political polarization and erosion of social cohesion in many advanced and emerging economies. This has led to the emergence of a worldwide consensus on the need for a more Inclusive and sustainable model of growth and Development that promotes high living standards for help narrow the gap between aspiration and action, the World Economic Forum System Initiative on Shaping the Future of Economic Progress last year introduced a new economic policy framework and performance metric in its Inclusive Growth and Development Report 2017 .
2 The framework identifies 15 areas of structural economic policy and institutional strength that have the potential to contribute simultaneously to higher growth and wider social participation in the process and benefits of such growth. The structural policies and institutions in these domains collectively represent the system through which modern market economies diffuse gains in living standards. Governments often fail to appreciate the potential of policy in these areas to increase the rate of growth and spread its benefits more widely, particularly in demand-constrained and low-productivity contexts. Underemphasis of these policies relative to macroeconomic, trade, and financial stability policies is a key reason for many governments failure in recent decades to mobilize a more effective response to widening inequality and stagnating median income as technological change and globalization have gathered force.
3 This policy imbalance is reinforced by the prevailing metric of national economic performance, the gross domestic product (GDP), which measures the aggregate amount of goods and services produced in an economy. Most citizens evaluate their respective countries economic progress not by published GDP growth statistics but by changes in their households standard of living a multidimensional phenomenon that encompasses income, employment opportunity, economic security, and quality of life. And yet, GDP growth remains the primary focus of both policymakers and the media, and is still the standard measure of economic success.
4 What gets measured gets managed, and the primacy of GDP statistics tends to reinforce the amount of attention paid by political and business leaders to macroeconomic and financial stability policies, which influence the overall level of economic activity, relative to that paid to the strength and equity of institutions and policy incentives in such areas as skills Development , labor markets, competition and rents, investor and corporate governance, social protection, infrastructure, and basic services. These play an important role in shaping Summary and Data HighlightsThe Inclusive Development Index 2018 | 3 Summary and Data Highlights2 | The Inclusive Development Index 2018dominate the Index , with Australia (9) the only non-European economy in the top 10.
5 Of the G7 economies, Germany (12) is ranked highest, followed by Canada (17), France (18), United Kingdom (21), United States (23), Japan (24), and Italy (27). In many countries, there is a stark difference between individual pillars: for example, the US ranks 10th out of the 29 advanced economies on Growth and Development , but 26th on Intergenerational Equity and Sustainability and 28th on Inclusion; France, meanwhile, ranks 12th on Inclusion, 21st on Growth and Development , and 24th on Intergenerational Equity and Sustainability. Low scores on the latter pillars suggest an economy may be storing up problems for the the ranking of emerging economies, six European economies are among the top 10: Lithuania (1), Hungary (2), Latvia (4), Poland (5), Croatia (7), and Romania (10).
6 These economies perform particularly well on Growth and Development , benefiting from EU membership, and Inclusion, with rising median living standards and declining wealth inequality. Latin America accounts for three top 10 economies: Panama (6), Uruguay (8), and Chile (9).Performance is mixed among BRICS economies: the Russian Federation (19) is ahead of China (26), Brazil (37), India (62), and South Africa (69). Although China has ranked first among emerging economies in GDP per capita growth ( ) and labor productivity growth ( ) since 2012, its overall score is brought down by lackluster performance on Inclusion.
7 Turkey (16), Mexico (24), Indonesia (36), and the Philippines (38) are among economies which show potential on the pattern of economic activity and particularly the breadth of social participation in the process and benefits of growth. GDP growth is best understood as a top-line measure of national economic performance, in the sense that it is a means (albeit a crucially important one) to the bottom-line societal measure of success: broad-based progress in living standards. As many countries have experienced and the Inclusive Development Index data illustrate, growth is a necessary but not sufficient condition for robustly rising median living standards.
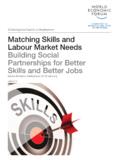
8 Accordingly, policymakers and citizens alike would benefit from having an alternative, or at least complementary, bottom-line metric that measures the level and rate of improvement in shared socioeconomic progress. Designed as an alternative to GDP, the Inclusive Development Index (IDI) reflects more closely the criteria by which people evaluate their countries economic progress (Figure 1). Table 1 presents the updated 2018 results and global rankings of 103 economies for which data are available. It ranks economies in two groups advanced and emerging. Individual indicator scores are compared in a traffic-light shading format in quintiles in Tables 4-7.
9 Additional data and tools can be found on the interactive web page: and Key Findings:Norway is the best performing advanced economy in 2018, with a consistently strong performance: it ranks second on one of the Index s three pillars (Intergenerational Equity and Sustainability) and third on each of the other two (Growth and Development , and Inclusion). Small European economies Growth and DevelopmentGDP (per capita)Labor Productivity EmploymentHealthy Life ExpectancyInclusionNational Key Performance IndicatorsMedian Household IncomeIncomeGiniPoverty RateWealthGiniIntergenerational Equity and SustainabilityAdjusted Net SavingsDependency RatioPublic Debt(as a share of GDP)Carbon Intensityof GDPF igure 1: Inclusive Growth and Development Key Performance IndicatorsNote: IDI scores are based on a 1-7 scale: 1=worstand 7=best.
10 Trends are based on percentagechange between 2012 and 2016 (using indicatorsavailable during both years). Advanced and emerging economy IDI scores are not strictly comparable due to different definitions of economies are not covered due to missingsub-pillar data including Cambodia, Kenya, Morocco, and singapore , which were missing historical trend data on Inclusion-related : World Economic Forum, The Inclusive Growth and Development Report 2017 Source: World Economic Forum 1 Norway 2 Iceland 3 Luxembourg 4 Switzerland 5 Denmark 6 Sweden 7 Netherlands 8 Ireland 9 Australia 10 Austria 11 Finland 12 Germany 13 New Zealand 14 Belgium 15 Czech Republic 16 Korea, Rep.