Transcription of The Index of Multiple deprivation (IMD2019): Headline ...
1 Strategic Commissioning Analytics, Kent County Council Strategic Commissioning Statistical Bulletin January 2020 The Index of Multiple deprivation ( imd2019 ): Headline findings for Kent Related Documents The Index of Multiple deprivation ( imd2019 ) is the official measure of relative deprivation in England and is part of a suite of outputs that form the English Indices of deprivation 2019 (IoD2019). This bulletin presents the findings for Kent. There are 901 Lower Super Output Areas (LSOAs) in Kent. A total of 555 remained within the same decile for imd2019 as they were in IMD2015. This accounts for 62% of all Kent LSOAs. The number of Kent LSOAs that are within the 10% most deprived LSOAs in England between the imd2019 and the previous IMD2015 remains at 51. The level of deprivation in nine out of 12 Kent local authority districts has increased since IMD2015 relative to other areas in England.
2 Thanet continues to rank as the most deprived local authority in Kent. Tunbridge Wells continues to rank as the least deprived local authority in Kent. Tonbridge & Malling has experienced the largest increase in deprivation relative to other areas. Gravesham has experienced the largest decrease in deprivation relative to other areas. The deprivation and Poverty web page contains more information which you may find useful. Children in Poverty Homelessness Unemployment and benefits claimants Rough Sleepers NOTE: within this bulletin Kent refers to the Kent County Council (KCC) area which excludes Medway Unitary Authority Contact details Strategic Commissioning-Analytics: Kent County Council Invicta House Maidstone Kent ME14 1XX Email: Tel: 03000 417444 Strategic Commissioning - Analytics, Kent County Council Page 1 Overview of the Indices of deprivation 2019 The Indices of deprivation 2019 (IoD2019) Is produced by the Ministry of Housing, Communities and Local Government (MHCLG) and provides a set of relative measures of deprivation for neighbourhoods or small areas called Lower-layer Super Output Areas (LSOAs) across England.
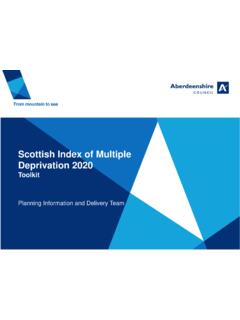
3 The IoD2019 is based on 39 separate indicators, organised across seven distinct domains and 4 sub-domains of deprivation . These are combined and weighted to calculate the overall Index of Multiple deprivation 2019 ( imd2019 ). The imd2019 is the most widely used of these indices. The imd2019 , domain indices and the supplementary indices, together with the higher area summaries, are collectively referred to as the IoD2019. Geography and spatial scale The IoD2019 provides a measure of deprivation experienced by people living in each neighbourhood or LSOA. LSOAs were developed by the Office for National Statistics (ONS) before the 2011 Census. There are 32,844 LSOAs in England with an average of 1,500 residents each and are a standard way of dividing up the country. They do not have descriptive place names like local electoral wards or parishes do but are named in a format beginning with the name of the local authority district followed by a 4-character code Ashford 001A.
4 All LSOAs in England are ranked according to their level of deprivation relative to that of other areas. A rank of 1 being the most deprived and a rank of 32,844 being the least deprived. High ranking LSOAs or neighbourhoods can be referred to as the most deprived or as being highly deprived to aid interpretation. However, there is no definitive threshold above which an area is described as deprived . The The English Indices of DeprivationIndex of Multiple DeprivationIncome deprivation domainEmployment deprivation domainHealth deprivation & disability domainEducation, skills & training deprivation domainBarriers to housing & services domainCrime domainLiving environment deprivation domain||||||||sub-domainssub-domainssub- domainssub-domainsIDACIIDAOPIC hildren & young peopleAdult skillsGeographical barriersWider barriersIndoors OutdoorsIDACI - Indices of deprivation affecting children indexIDAOPI - Indices of deprivation affecting older people Index Strategic Commissioning - Analytics, Kent County Council Page 2 IoD2019 measure deprivation on a relative rather than an absolute scale, so an LSOA ranked 100th is more deprived then an LSOA ranked 200th, but this does not mean it is twice as deprived.
5 It is common to describe how relatively deprived a small area is by saying whether it falls among the most deprived 10 per cent, 20 per cent or 30 per cent of small areas in England (although there is no definitive cut-off at which an area is described as deprived ). To help with this, deprivation deciles are published alongside ranks. Deciles are calculated by ranking the 32,844 small areas in England from most deprived to least deprived and dividing them into 10 equal groups. These range from the most deprived 10 per cent of small areas nationally to the least deprived 10 per cent of small areas nationally. Summary measures have been produced for the following higher-level geographies: lower tier local authority districts Local Authority upper-tier local authorities Counties, Metropolitan counties, & Unitary Authorities local enterprise partnerships clinical commissioning groups.
6 The Data As far as is possible, each indicator is based on data from the most recent time point available. Using the latest available data in this way means that there is not a single consistent time point for all indicators. However, in practice most indicators in the IoD2019 relate to a 2015/16 timepoint. As a result, the indicators do not take into consideration any changes to policy since the time point of the data used. For example, the 2015/16 benefits data used do not include the impact of the roll out of Universal Credit, which only began to replace certain income and health related benefits from April 2016. Uses of the IMD and IoD Since their original publication in 2000 the Indices have been used widely for a variety of purposes, including the following: Targeting resources, services and interventions Policy and strategy As an analytical resource to support commissioning by local authorities and health services, and in exploring inequalities.
7 Funding bids Strategic Commissioning - Analytics, Kent County Council Page 3 This bulletin presents the imd2019 in comparison with IMD2015 at LSOA level in Kent and Medway. Summary measures for IMD2015 and imd2019 at local authority and county level are also presented. Due to the large number of LSOAs in Kent (902) the tables in this bulletin show only the most deprived 10% LSOAs in Kent. Full lists of all LSOAs in Kent & Medway with scores and ranks for all the domains are available in Excel format on request from Strategic Commissioning Analytics. e:-mail or telephone 03000 417444 The 2019 IMD has not been made available at ward level. However following guidance from MHCLG we have produced a separate ward level imd2019 summary that is available in a separate document. Further information Further information about the Indices of deprivation 2019 is available from The Ministry of Housing, Communities and Local Government via their website.
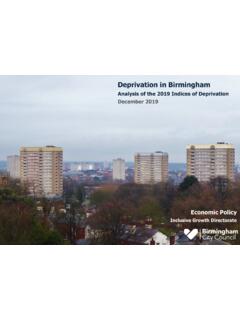
8 Strategic Commissioning - Analytics, Kent County Council Page 4 deprivation at small area level in Kent s Lower Super Output Areas The number of Kent LSOAs that are within the 10% most deprived LSOAs in England between the IMD2015 and the imd2019 remains at 51. Although there has been no direct increase in the number of the most deprived areas within Kent there have been changes within the lesser deprived areas The number of Kent LSOAs within the 10 to 20% most deprived LSOAs in England has increased from 65 in 2015 to 81 in 2019. The number within the 40-50% most deprived have also increased from 96 to 122. At the other end of the spectrum, the numbers of LSOAs within the 10% least deprived LSOAs in England has decreased from 93 in 2015 to 88 in 2019. Chart 1 shows the changes in of Kent LSOAs within all of the deciles of the IMD2015 and imd2019 .
9 Chart 1: Number of Kent LSOAs in each decile of the IMD2015 and imd2019 5165709096125126959193518168921221091179 28288 Most deprived 10%10-20%20-30%30-40%40-50%50-60%60-70%7 0-80%80-90%Least deprived 10%Number of Kent LSOAs in each decile of the IMD 2015 and IMD 201920152019 Source: IMD 2015 and imd2019 , MHCLG. Chart presentedby Strategic Commissioning -Analytics, Kent County Council Strategic Commissioning - Analytics, Kent County Council Page 5 Thanet has the most LSOAs within the most deprived decile with 18. This figure has also remained the same since the IMD2015. The number of Folkestone & Hythe LSOAs within the 10% most deprived has also remained the same between the IMD2015 and imd2019 . Four local authorities have experienced an increase in the number of LSOAs within the most deprived decile. These are Swale (+2), Ashford and Dover (both with +1) and Canterbury which now has 2 LSOAs within the 10% most deprived LSOAs for imd2019 when there were none in the IMD2015.
10 There has been a reduction in the number of LSOAs within the 10% most deprived within Dartford (-2) and Gravesham (-4). Sevenoaks, Tonbridge & Malling and Tunbridge Wells do not have any LSOAs within the 10% most deprived Medway Unitary authority has also seen an increase in the number of LSOAs in the 10% most deprived LSOAs between IMD2015 and imd2019 . Table 1: imd2019 and IMD2015: Kent & Medway LSOAs within the top 10% most deprived in England The change in numbers of LSOAs within each of the deciles does not identify which areas have improved or declined. Chart 2 presents the proportion of LSOAs that have remained within the same decile in imd2019 as IMD2015. Within the top 10% most deprived: IMD 2015 Within the top 10% most deprived: IMD 20192015 - 2019 ChangeAuthorityNumber%Number%Number of LSOAsKent902516%516%0 Thanet841835%1835%0 Swal e851427%1631%2 Dover6748%510%1 Fol kes tone & Hythe6748%48%0 Canterbury 9000%24%2 Graves ham64612%24%-4 Mai ds tone9524%24%0As hford 7800%12%1 Dartford5836%12%-2 Sevenoaks7400%00%0 Tonbri dge & Mal l i ng7200%00%0 Tunbri dge Wel l s6800%00%0 Medway ranked by highest number of LSOAs in top 10% most deprived by imd2019 Score* A minus change illustrates a reduction in the number of LSOAs within the 10% most deprived areas in England.