Transcription of The Millennium Drought and 2010/11 Floods - SEACI
1 SEACI is a partnership between the CSIRO Water for a Healthy Country Flagship, the bureau of Meteorology, the Murray Darling Basin Authority, the Victorian Department of Sustainability and Environment, and the Australian Government Department of Climate Change and Energy Millennium Drought and 2010/11 FloodsThe statistics in this factsheet were derived using the latest gridded rainfall observations as developed by the bureau of Meteorology as part of the Australian Water Availability Project (AWAP) averaged over continental Australian south of S and east of E (depicted as red rectangle in Figure 1). Data are publicly available at: < cgi-bin/silo/cli_ >.The recent Drought in historical contextBetween 1997 and 2009, south-eastern Australia experienced the most persistent rainfall deficit since the start of the 20th century.
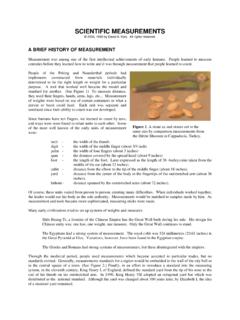
2 Annual rainfall during the so-called Millennium Drought was 73 mm below average (or below the 20th century mean) for the years 1997 2009 inclusive. Other significant dry periods occurred throughout the 20th century, however they were not as dry for as long. The period 1932 1945 was the next driest 14 years on record, however this period had a rainfall deficit of just around half that observed throughout the Millennium Drought . The 1932 45 dry period (encompassing the WWII Drought ) had a geographical character which saw it spread across most of the continent. The Millennium Drought differed from this significantly in that it was largely limited to south-eastern and south-western Australia while the bulk of the continent experienced above average rainfall, as shown in Figure 1.
3 The Millennium Drought was also distinctive with regards to its seasonality. The rainfall decline occurred between March and October with around two-thirds of the rainfall deficit occurring in autumn, with smaller reductions throughout the rest of the year. By comparison, during the WWII Drought , rainfall declines tended to be greatest in the spring months. The 2010/11 La Ni a event and the flooding across south-eastern AustraliaIn 2010/11 , the world experienced one of the strongest La Ni a episodes on record. Comparably strong La Ni a events had not been recorded since the 1970s, and while there were a few La Ni a events throughout the Millennium Drought , they did not bring significant rainfall to south-eastern Australia. As a result of this strong La Ni a, significant and widespread increases in rainfall were observed across Australia.
4 The episode produced widespread flooding across south-eastern Australia, with the largest impact occurring in the north of the region. The Murray Darling Basin experienced its largest annual rainfall total on record. South-eastern Australia recorded its fourth highest annual rainfall with 810 mm. RainfallHighest onrecordVery muchabove averageAbove averageAverageBelow averageVery muchbelow averageLowest onrecordFigure 1. The Millennium Drought (1997 2009) saw major reductions in rainfall across south eastern Australia (depicted by the red rectangle). Data based on climatology from 1900 to 2009 ( bureau of Meteorology)The suite of four factsheets is available from or by emailing CSIRO, July 2011 The greatest positive rainfall anomalies for 2010 were located in the northern half of south-eastern Australia, with a significantly lower impact occurring south of the Great Dividing Range, where tropical influences such as La Ni a are reduced.
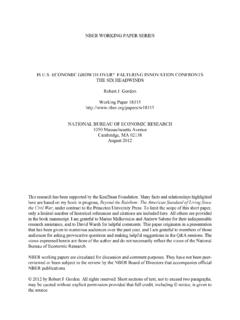
5 Throughout this La Ni a episode the greatest rainfall anomalies in south-eastern Australia were recorded in spring (247 mm, or 60% above the 20th century average) and in the 2010/11 summer when 303 mm was recorded (150% above the 20th century average). This is the largest summer total ever recorded by a considerable margin. The impact of the strong La Ni a was exacerbated by the Southern Annular Mode (SAM), which reached record positive values in late spring and early summer of 2010. In addition, one of the largest negative Indian Ocean Dipole (IOD) events of the last 50 years was recorded in 2010 (Figure 2). Despite the La Ni a episode, below-average rainfall (192 mm, 11% below the 20th century average) was recorded in April July 2010, continuing the established pattern of below-average rainfall during the autumn months.
6 This trend has continued into 2011, with rainfall throughout April to June 2011 being 25% below the 20th century average. The relationship with global warmingSEACI researchers have analysed the observed climate record and found that the El Ni o Southern Oscillation and other large-scale modes of variability cannot explain the observed decline in autumn and early-winter rainfall in south-eastern Australia. SEACI researchers have, however, found a strong relationship between the rainfall decline in south-eastern Australia and the intensity of the sub-tropical ridge (STR), with the decrease in rainfall strongly associated with increasing surface pressure in the latitudes of the STR. The strengthening of the STR is estimated to account for around 80% of the recent rainfall decline in south-eastern indicates that there are changes in the Hadley Cell (and hence changes in the STR) associated with global warming.
7 In particular, the STR has intensified with increasing global surface temperature. This result implies that the rainfall decline in south-eastern Australia may have some link to global warming. To investigate this, SEACI researchers conducted simulations of the global climate over recent decades using a global climate model and different external forcings (natural and anthropogenic). In these simulations, the climate model was only able to reproduce STR increases and other modifications of the Hadley Cell when anthropogenic forcings ( greenhouse gases) were present in the simulation along with the natural forcings. This gives confidence that there is a link between the rainfall decline across south-eastern Australia and increasing greenhouse gas concentrations in the atmosphere.
8 Warmest sea surface temperatures on record north of AustraliaMONSOONSTRONG EASTERLIESI ndian Ocean Dipole (IOD)One of the three largest negative IOD events in the last 50 yearsEl Ni o SouthernOscillation (ENSO) 2010/11 : A very strongLa Ni a event. Highest summer SOI on recordSouthern Annular ModeSpring 2010: largest positive anomaly on recordclimate driverUPPER LEVEL TROUGHTROPICAL DEPRESSIONSFRONTAL SYSTEMSLSTRONG INTERACTIONSH ighest spring & summer rainfall on record in south-eastern AustraliaThe sub-tropical ridge (STR)The sub-tropical ridge is a belt of high pressure stretching across the mid-latitudes. It is the surface signature of the Hadley Cell which is the most fundamental component of the global climate system. It is the process by which heat from the sun, which falls mainly in the tropics, is transported from equatorial zones to the mid-latitudes in the 2.
9 In 2010/11 , south eastern Australia recorded record breaking rainfall in spring and summer due to the combination of the positive phase of all large scale modes of variability known to contribute to the year to year variability of rainfall: ENSO, IOD and SAMFACTSHEET 2 OF 4