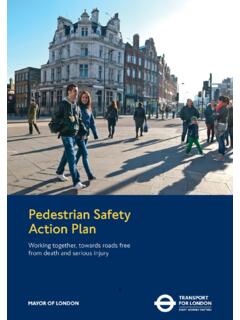
Transcription of The New York City Pedestrian Safety Study & Action Plan
1 1 New york city Pedestrian Safety Study & Action PlanThe New york CityPedestrian Safety Study & Action PlanNew york city Department of TransportationAugust 20101 New york city Department of Transportation2 New york city Pedestrian Safety Study & Action PlanCONTENTSL etter from the CommissionerExecutive SummaryIntroductionFindings - Pedestrian Crashes in New york city : Where When How WhoAction plan Engineering Enforcement Public Communication Policy & Legislation Interagency Coordination & CooperationReferencesAcknowledgements468 203245473 New york city Department of Transportation4 New york city Pedestrian Safety Study & Action PlanDear fellow New Yorkers:Over the past decade we have made tremendous progress in reducing traffic fatalities in New york city . 2009 was in fact the safest year on record since the city began collecting data in 1910; annual traffic fatalities are down by 35 percent compared to 2001.
2 New york s streets are far safer than any other big city in this country. Our traffic fatality rates are more on par with world class cities such as London, Paris or Berlin. But even one fatality is too many. DOT aims to reduce by half the number of traffic deaths by 2030. In order to do this the agency has collected and analyzed more data about the causes of traffic deaths and injuries and where they are happening. We are using this information to design better streets. LETTER FROM THE COMMISSIONERThis first, unprecedented Pedestrian Safety Action plan examines eight years of data about traffic crashes that have caused serious injuries or fatalities to pedestrians, and identifies underlying causes that we can address to reduce these crashes. This plan builds upon DOT s strategic plan , Sustainable Streets, and the work the agency has done in accordance with Local Law 11 (Council Intro 567-A, 3), signed by Mayor Bloomberg into law in April streets that protect pedestrians and reinforce the speed limit are just one piece of the Safety puzzle.
3 DOT will also seek legislation to increase the city s enforcement capabilities, to prevent dangerous speeding and red light-running. And we will use our Safety Education and Communications offices to begin to transform the culture of New york city streets, building more respect and Safety for all street users. We will also work with other city agencies including NYPD and the Department of Health to continue to collect better data and optimize our traffic Safety initiatives. Our goals are simple and clear, and they stem from Mayor Bloomberg s PlaNYC and public health agendas. We must continue making our streets safer for everyone, and promote more healthful and sustainable modes of transportation like walking. This Action plan suggests ways to move forward on both fronts, so that we can continue to drive down traffic fatalities and ensure New york truly has world class streets that are safe for everyone.
4 Sincerely,Janette Sadik-KhanCommissioner5 New york city Department of Transportation6 New york city Pedestrian Safety Study & Action PlanExecutive SummaryKey Findings of the New york city Pedestrian Safety Study 2010-2011 Action PlanThis landmark Study is the most statistically ambitious of its kind ever undertaken by a US city . The researchers worked to identify the causes, common factors, and geographic distribution of over 7,000 Pedestrian crashes in New york city . These are some of the results. 2009 was the safest year on record in New york city history. Traffic fatalities in 2009 were down by 35% from 2001. NYC s traffic fatality rate is about one-quarter of the national rate and less than half the rate of the next 10 largest cities. Traffic crashes cost the city s economy $ billion annually. Pedestrians are ten times more likely to die than a motor vehicle occupant in the event of a crash.
5 Pedestrians accounted for 52% of traffic fatalities from 2005-2009. Driver inattention was cited in nearly 36% of crashes resulting in pedestrians killed or seriously injured. 27% of crashes that kill or seriously injure pedestrians involved driver failure to yield. Serious Pedestrian crashes involving unsafe speeds are twice as deadly as other such crashes. Most New Yorkers do not know that the standard speed limit for city streets is 30mph. 80% of crashes that kill or seriously injure pedestrians involve male drivers. 79% of crashes that kill or seriously injure pedestrians involve private automobiles as opposed to taxis, trucks and buses. Serious Pedestrian crashes are about two-thirds more deadly on major street corridors than on smaller local streets. Manhattan has four times as many pedestrians killed or severely injured per mile of street compared to the other four boroughs.
6 43% of pedestrians killed in Manhattan lived in another borough or outside of New york city . Based on the findings of this Study , DOT recommends a comprehensive set of actions; select programs are shown below. Install countdown Pedestrian signals at 1,500 intersections. Re-engineer 60 miles of streets for greater Pedestrian Safety , according to corridor crash data. Re-engineer 20 intersections for Pedestrian Safety on major Manhattan two-way streets. Launch a pilot program to test the Safety performance of neighborhood 20 mph zone. Implement pilot program to improve visibility at left turns along avenues in york city Department of TransportationNew york city vs. International Cities & US Peer Cities*Traffic Fatalities in Perspective New york city s traffic fatality rateis lower than Copenhagen s and nearly equal to Amsterdam s051510 Fatalities per 100,000 PopulationNYCNYC Traffic Fatalities in Comparison to National and International CitiesStockholmBerlinTokyoHong KongLondonParisAmsterdam (2007)Portland, ORNew york , NYCopenhagen (2007)Seattle, WABoston, MASan Francisco, CAMilwaukee, WIWashington, DCChicago, ILPhiladelphia, PABaltimore, MDLos Angeles, CADetroit, MIAtlanta, (2008 data unless otherwise noted) 8 New york city Pedestrian Safety Study & Action PlanINTRODUCTIONS omething remarkable has been taking place in New york city .
7 Traveling the streets of America s largest city has grown dramatically safer for all its users. From 1990 to 2009, annual fatalities involving all road users have dropped by 63%; the streets are now nearly three times safer than in 1990. Most impressively, since 2004, the number of annual traffic fatalities has been lower than 1910 levels, the first and historically lowest count on record. In 2009, the city experienced 256 traffic fatalities, an all-time record low. NYC is the safest large US city and is growing saferCurrent Trends in Traffic FatalitiesNew york city is also a safer place to walk than its peer cities* in the In 2008, New york city had a Pedestrian fatality rate of per 100,000, 15% lower than the average of 12 peer cities. The city s Pedestrian fatality rate was also many times lower than such peer cities as Atlanta ( ), Detroit ( ) and Los Angeles ( ). This is especially significant given that percentage of trips taken on foot is so much higher in New york city than in these more auto-oriented urban terms of Pedestrian Safety , fatality rates have also declined dramatically over the last twenty years, dropping 41% from the decade of 1990-1999 to the decade of 2000-2009.
8 This decline does not appear to have resulted primarily from better emergency response and life-saving techniques, since the Pedestrian severe injury rate improved at the same pace as the fatality rate, decreasing 40% over the same period. While national traffic fatalities have dropped significantly (24%) during this time period, the decrease in New york city was dramatically more pronounced. Moreover, as of 2008, national fatality rates per 100,000 residents were over three times higher than New york city s ( vs. ). Compared to the ten other largest US cities, New york ranks as the safest, with a fatality rate less than half their average ( vs. ).In fact, New york city s Safety record is comparable to that of major Pedestrian -oriented European cities; in 2008 New york city s fatality rate was lower than Copenhagen ( ), nearly equal to Amsterdam ( ) and just above Paris ( ) and London ( ).
9 NYC Actual Traffic Fatalities & Reduction Target(1990-2030)Annual Traffic FatalitiesActualTarget010020030040050060 07008001990 1995 2000 2005 2010 2015 2020 2025 2030*NYC s US peer cities are cities with populations greater than 500,000, population densities greater than 5,000 per square mile and/or a rate of non-automotive commuting of over 20%.9 New york city Department of TransportationDOT Safety GOAL:Reduce Traffic Fatalities by 50% by 2030 Looking to the FutureDespite these significant gains, there is still much work to be done. Although great improvements have been made in the last two decades, the rate of improvement has slowed over the last few years. Mayor Michael Bloomberg and Department of Transportation (DOT) Commissioner Janette Sadik-Khan have called for a more aggressive Safety approach for the future; the 2008 DOT Strategic plan (Sustainable Streets ) calls for cutting annual traffic fatalities 50% from 2007 levels by 2030, from 274 to 137.
10 Reaching this goal would save over 1600 lives over the next two reach this goal (an average 3% fatality reduction per year), DOT is formulating citywide strategies that engage key agencies like New york city Police Department (NYPD), New york city Health Department (DOHMH), and New york State Department of Motor Vehicles (DMV). As of 2009, the city is ahead of schedule with only 256 total traffic fatalities in 2009, slightly below the year s reduction target of Bloomberg has recognized the urgency of reaching this goal; as stated in Sustainable Streets, he is committed to improving traffic Safety as a fundamental public health issue. Traffic fatalities and injuries have wide impacts on the city in terms of economic, equity, environmental and quality-of-life costs. Moreover, traffic fatalities and injuries are not an unavoidable consequence of an auto-oriented society. Road Safety is an issue that can be substantially addressed by informed design and engineering, education and enforcement.
