Transcription of The New Zealand tax system and how it compares ...
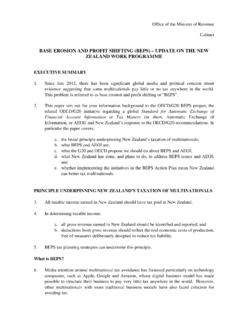
1 The New Zealand tax system and how it compares internationally Prepared by Inland Revenue, October 2017 Contents An overview of tax revenue .. 1 Personal income tax .. 3 GST .. 6 Company tax .. 6 Progressivity of the personal tax system .. 8 Effective marginal tax rates .. 10 Administration and 12 An overview of tax revenue The primary determinant of how much tax revenue is collected is the requirement to fund government expenditure. Figure 1 shows the trend for central government tax revenue. The ratio of revenue to GDP has been relatively stable, increasing slightly in recent years, reflecting the New Zealand economy s recovery since the global financial crisis. New Zealand collects an amount of tax revenue, relative to GDP, that is close to the average of other OECD countries. Figure 2 shows all tax revenue collected within a country, whether at the level of central, state or local government, as this is the concept most meaningful for international comparisons.
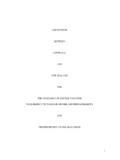
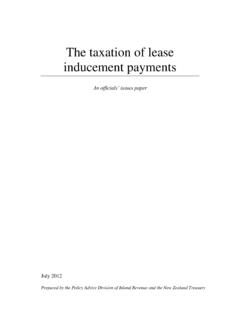
2 It therefore differs from Figure 1 which just shows central government revenue. For the 2015/16 year, central government taxes were of GDP and local government taxes were of GDP. 1 New Zealand collects a large share of revenue from its three major tax bases: personal income, company income and GST. As shown in Figure 3, more than 90% of our tax revenue is collected from these or similar taxes (including resident and non-resident withholding taxes and fringe benefit tax). New Zealand does not have taxes on transactions or turnover, such as stamp duty and cheque duty, which international tax reviews have identified as being particularly inefficient. Individual income tax, income tax, (including customs GST), , withholding tax, withholding tax, taxes & duties, , 3: New Zealand source of taxation revenue 12 months to June 2016 Source: NZ Treasury2 Figure 4 puts the composition of taxes in New Zealand in an international perspective.
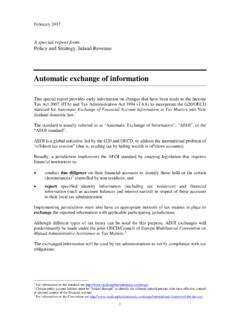
3 It shows that the three main tax types make up a larger share of total tax revenue than is the norm in other OECD countries. An important part of the reason for our relatively low percentage of other taxes is that New Zealand does not have social security taxes. Personal income tax New Zealand s tax system is based on a broad-base, low-rate (BBLR) framework. Having broad bases means that taxes are applied with few exemptions and concessions. As a consequence, New Zealand raises substantial amounts of tax revenue relative to the tax rates when compared with other countries. Figure 5 shows that New Zealand has a relatively low top personal tax rate. However, another feature demonstrated by Figure 5 is that the New Zealand tax scale is relatively flat. The top tax rate begins to apply at the low level of times the average wage. 3 Despite the relatively low top personal marginal tax rate, Figure 6 shows that New Zealand collects the fifth highest amount of personal income tax1 as a percentage of GDP among OECD countries.
4 The level of revenue raised from personal taxes in part reflects that New Zealand does not allow salary and wage earners to claim deductions for the many employment related expenses, such as for a home office, equipment or clothing, which can be claimed in other countries. This reduces compliance costs. In addition, we do not provide the large tax incentives for retirement savings found in other countries. 1 In the 2017 Budget, the Government announced changes to the personal income tax thresholds to apply from 1 April 2018. These adjustments are not reflected in Figure 6. 4 A further perspective on New Zealand s low rate system of taxation is the tax wedge that is, the average amount of tax that people pay on their labour income, once tax-related transfers are taken into account. Figure 7 shows the average tax wedge in New Zealand and in other countries for a worker on the average wage (in that country).
5 Two figures are shown for each country: a worker with no dependents and one with two dependent children. New Zealand , like almost all other countries, provides assistance through lower effective tax rates for workers with children. (In New Zealand , this is through the transfers received from the Working for Families scheme.) Figure 7 shows that New Zealand has the second-lowest average tax wedge for the average wage earner with no dependent children, and the lowest tax wedge for the worker with two dependent children. New Zealand s personal tax system levies tax on the first dollar of income while many other countries have a tax free threshold. Our low average tax wedge reflects the absence of other taxes, such as payroll or social security taxes, that many other countries have. 5 GST Despite having the sixth lowest rate of GST2, Figure 8 shows that New Zealand s GST collections amounted to 10% of GDP, the highest proportion in the OECD.
6 The very high amount of tax raised, despite New Zealand s relatively low rate of tax, mainly reflects the fact that New Zealand s GST base is particularly broad. However, it also reflects a different tax treatment of government appropriations from other countries. Other OECD countries typically make government departments exempt from GST, whereas New Zealand levies GST on the Government s appropriations to government departments, but allows departments to claim input credits on their purchases. If New Zealand adopted the more common treatment of making government departments exempt from GST, we estimate it would collect just under of GDP in GST. This would mean that New Zealand would collect about the eighth highest amount of GST as a proportion of GDP for the 34 OECD countries shown in Figure 8. Company tax Company tax is New Zealand s third main tax base. Despite cuts in 2008/09 and 2011/12 to New Zealand s company tax rate, it is higher than the OECD average, reflecting the international trend to lower rates for company tax, as shown in Figure 9.
7 The Australian rate in Figure 9 is the standard rate; small business entities (turnover less than AUS$10m) have a tax rate of 2 Figure 8 shows the statutory or headline rate for each country. This is the rate at which GST is levied, though in many countries other goods will be taxed at lower rates. 6 In 2015/16, New Zealand collected of GDP in company tax, which is the fourth highest in the OECD (see Figure 10 below). This is despite New Zealand having only the tenth highest company tax rate in the OECD. Again, this is testimony to New Zealand s relatively broad bases in relation to the taxes that it levies. 7 In the realm of company tax, the headline rate does not necessarily tell the full story in terms of the burden of the tax. For instance, New Zealand s full imputation system means that profits are eventually taxed at shareholders marginal rates when dividends are paid.
8 Shareholders can claim tax credits for company taxes that have been paid, which prevents company profits from being double taxed. This leads to a relatively low overall tax rate on corporate profits once they are distributed. Figure 11 shows that New Zealand has the sixth highest proportion across OECD countries where distributed profits are not further taxed in the hands of the shareholders. (The data in Figure 11 is based on shareholders being taxed at the top personal tax rate.) This makes New Zealand a relatively attractive place for entrepreneurs to live and base a business. Progressivity of the personal tax system A progressive tax system levies higher average tax rates on those with higher incomes. In combination with transfer payments such as Working for Families tax credits, working-age welfare benefits, New Zealand superannuation and the Accommodation Supplement, a progressive tax system reduces inequality.
9 (The Government also has redistributive goals for much of its expenditure, for instance on health and education, but this is not considered here.) 8 The Ministry of Social Development3 has analysed the impact of taxes and transfers by household income deciles. It finds that households in the highest deciles pay the bulk of the income tax the highest decile pays 35% of all income tax and the lowest four deciles each pay less than 5% of the income tax. Transfers have an opposite pattern the lowest three deciles receiving a larger share of transfers than the other deciles. The outcome is the lowest four deciles have a negative net tax liability, that is they receive more by way of government cash transfers than they pay in income tax. The net tax liability increases with each of deciles five to ten. A common measure of income equality is the Gini coefficient. With Gini coefficients, the higher the measure, the more unequal the distribution.
10 Figure 12 shows Gini coefficients before and after taxes and transfers. As with other countries, New Zealand s Gini coefficient after taxes and transfers is lower than its pre-tax Gini coefficient. The tax and transfer system reduces inequality. Figure 12 also shows that New Zealand s Gini coefficient for disposable income for 2013 is very similar to Australia s, and both are slightly above the OECD This is the most recent year for which the OECD has comparable international data. The Ministry of Social Development has published more recent data for New Zealand (see footnote 4). This indicates that the New Zealand Gini coefficients have been largely constant since the mid-1990s, following a rise in the late 1980s and early 1990s. Figure 13 shows the percentage reduction in the Gini coefficient across the OECD that arises as a result of taxes and transfer payments. New Zealand s tax and transfer system provides a similar reduction in measured income inequality to Canada, but a slightly smaller reduction than Australia or the OECD average.